Market Sizing Questions: How to Approach Them
Updated April 2026·15 min read
Summary: Market sizing questions test your ability to break down ambiguous problems and calculate under pressure. Use top-down (start big, filter down) or bottom-up (start small, multiply up) approaches. State assumptions clearly, use round numbers, and always sanity check your final answer.
Contents
What do market sizing questions actually test?
Market sizing questions ask you to estimate something without access to data. "How many gas stations are in the US?" "What is the annual revenue of the umbrella market in the UK?" "How many tennis balls fit in this room?"
These questions appear in most consulting interviews, either as standalone questions or embedded within larger cases. They test several skills simultaneously:
- Problem structuring: Can you break an ambiguous question into manageable parts?
- Logical reasoning: Does your approach make sense? Are your steps connected?
- Quantitative comfort: Can you work with numbers quickly and accurately?
- Assumption quality: Are your assumptions reasonable and well-reasoned?
- Communication: Can you explain your thinking as you go?
The exact number you arrive at matters less than how you get there. Two candidates can reach different answers and both pass, or reach the same answer and one fails. Interviewers are evaluating your thinking process.
What is the difference between Top-down and Bottom-up?
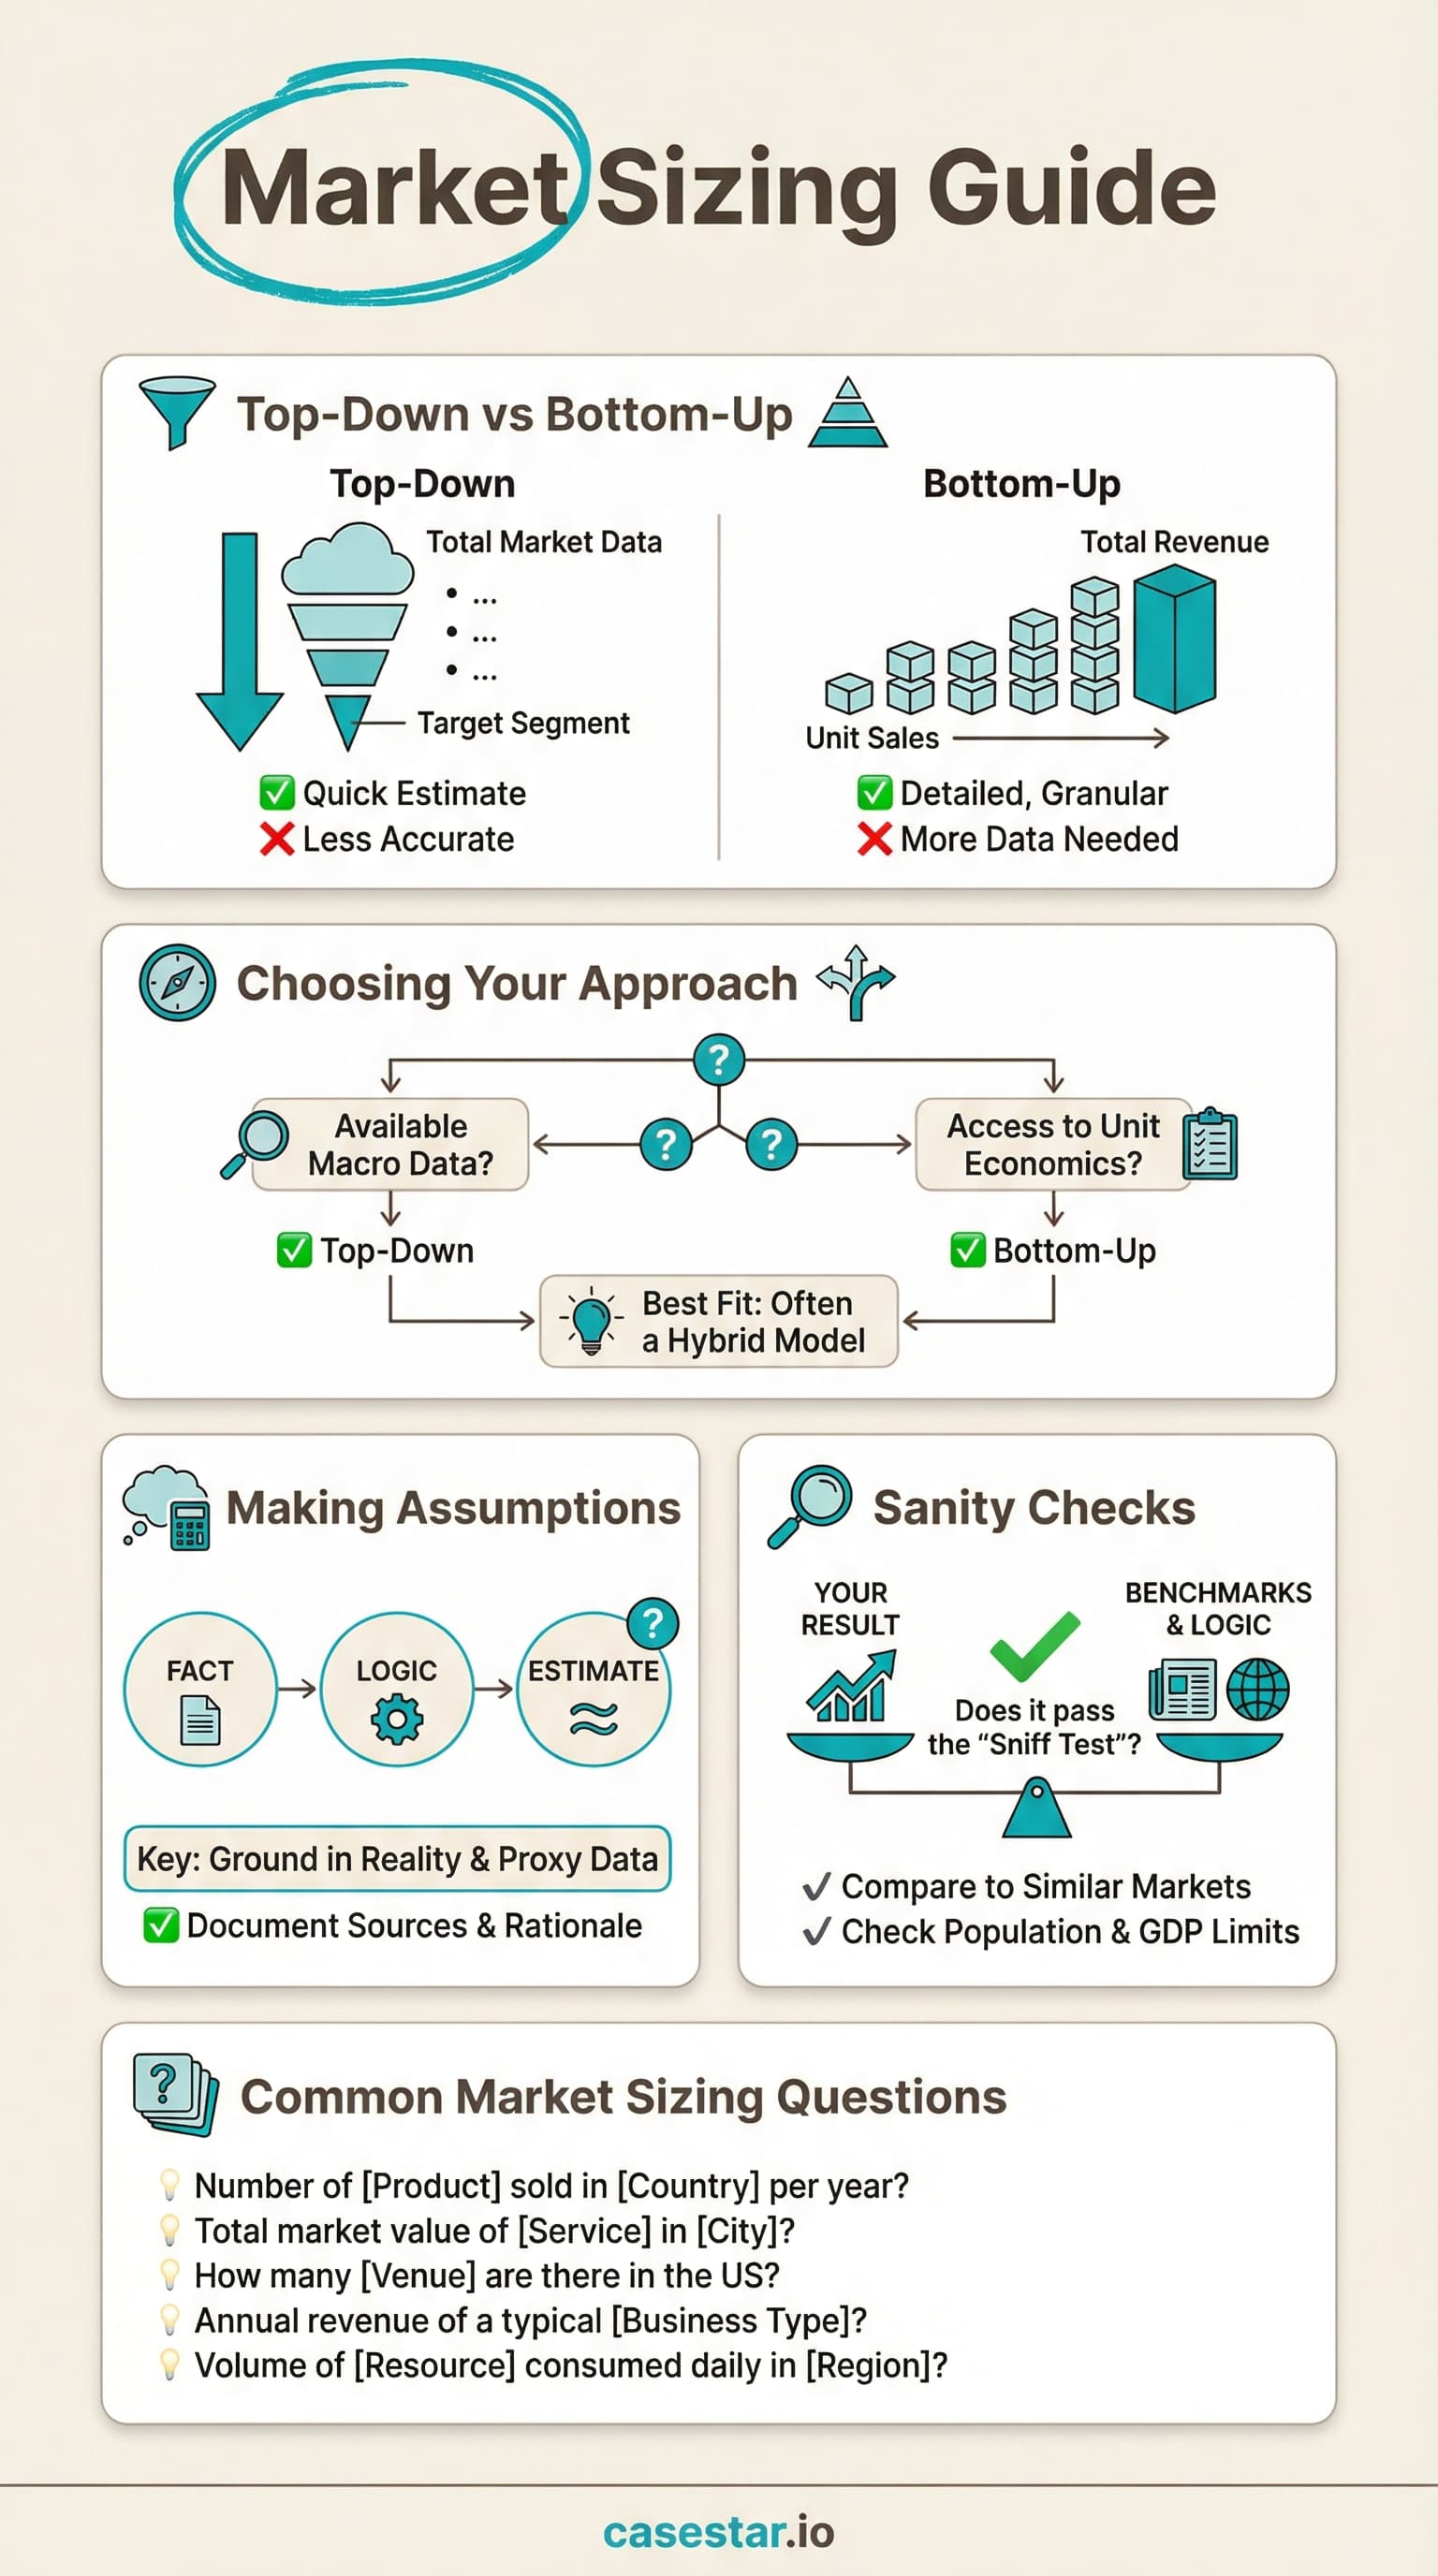
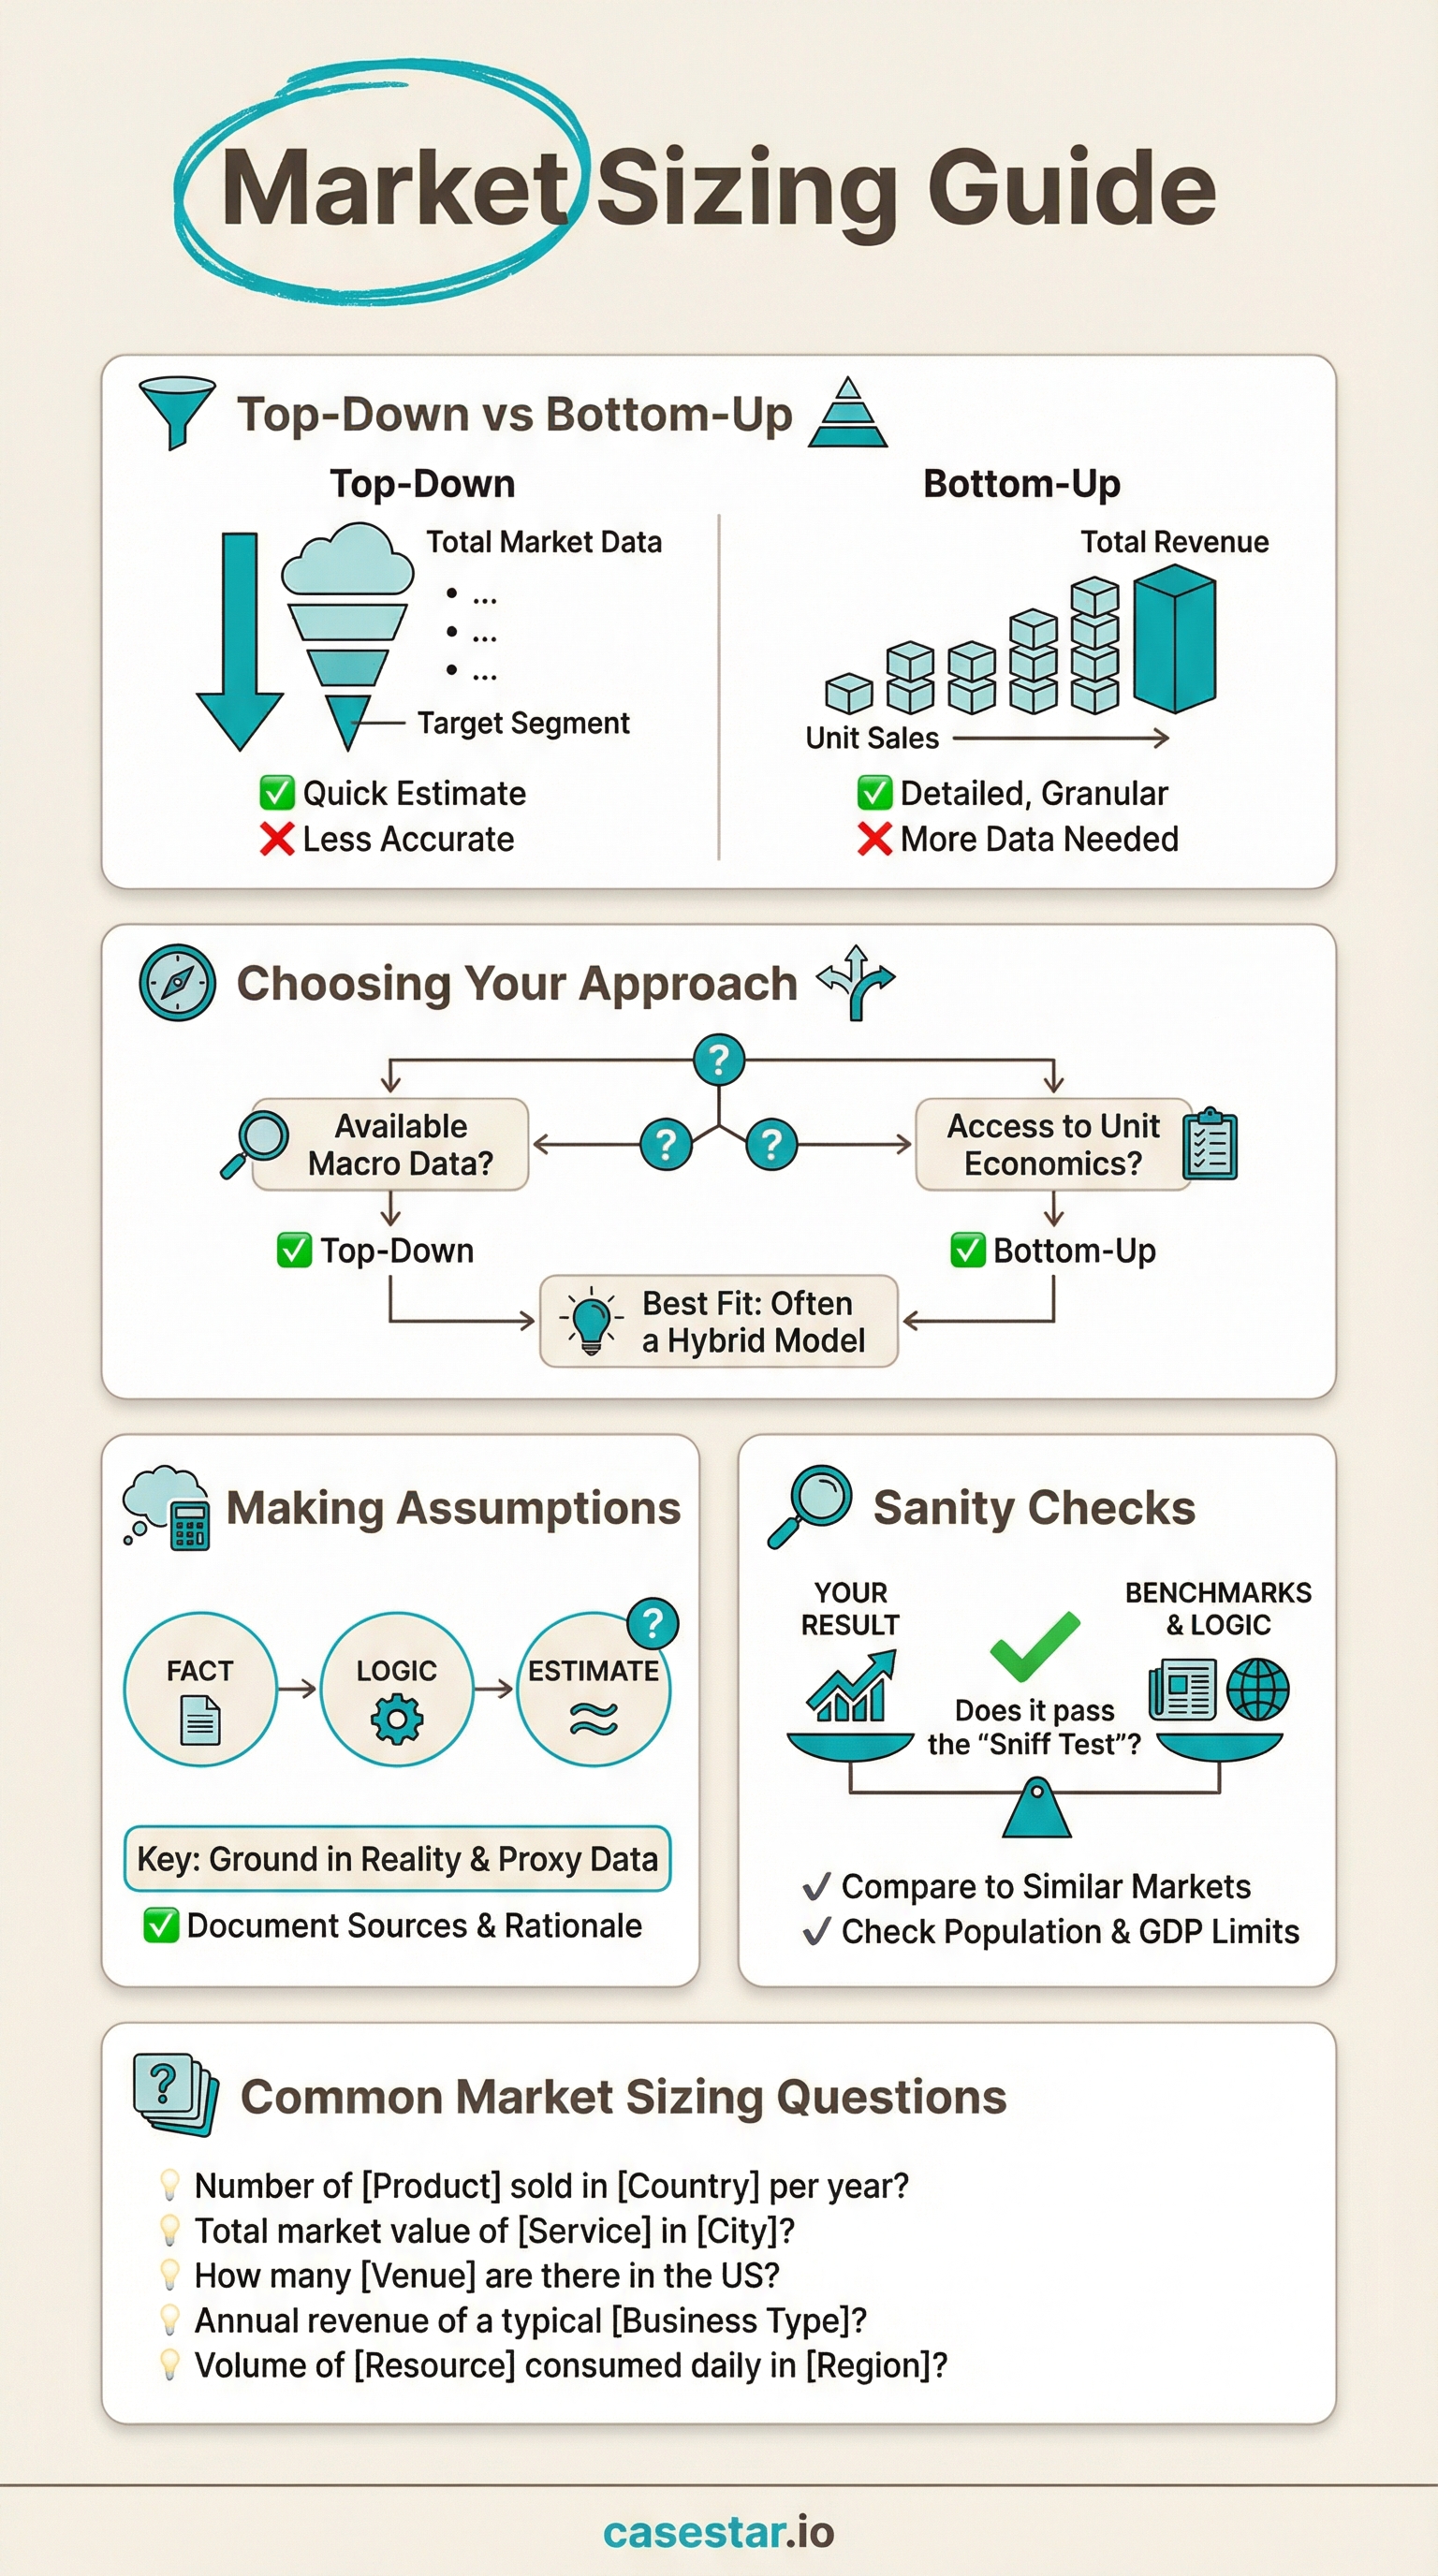
There are two main ways to approach market sizing. Each has strengths and weaknesses, and the best choice depends on the question.
| Aspect | Top-Down | Bottom-Up |
|---|---|---|
| Starting point | Large number (population, GDP) | Smallest unit (one store, one customer) |
| Direction | Filter down through percentages | Multiply up through quantities |
| Speed | Faster, fewer steps | Slower, more detailed |
| Precision | Less precise, wider margin | More precise, defensible |
| Best for | National/global markets, consumer products | Local markets, B2B, specific locations |
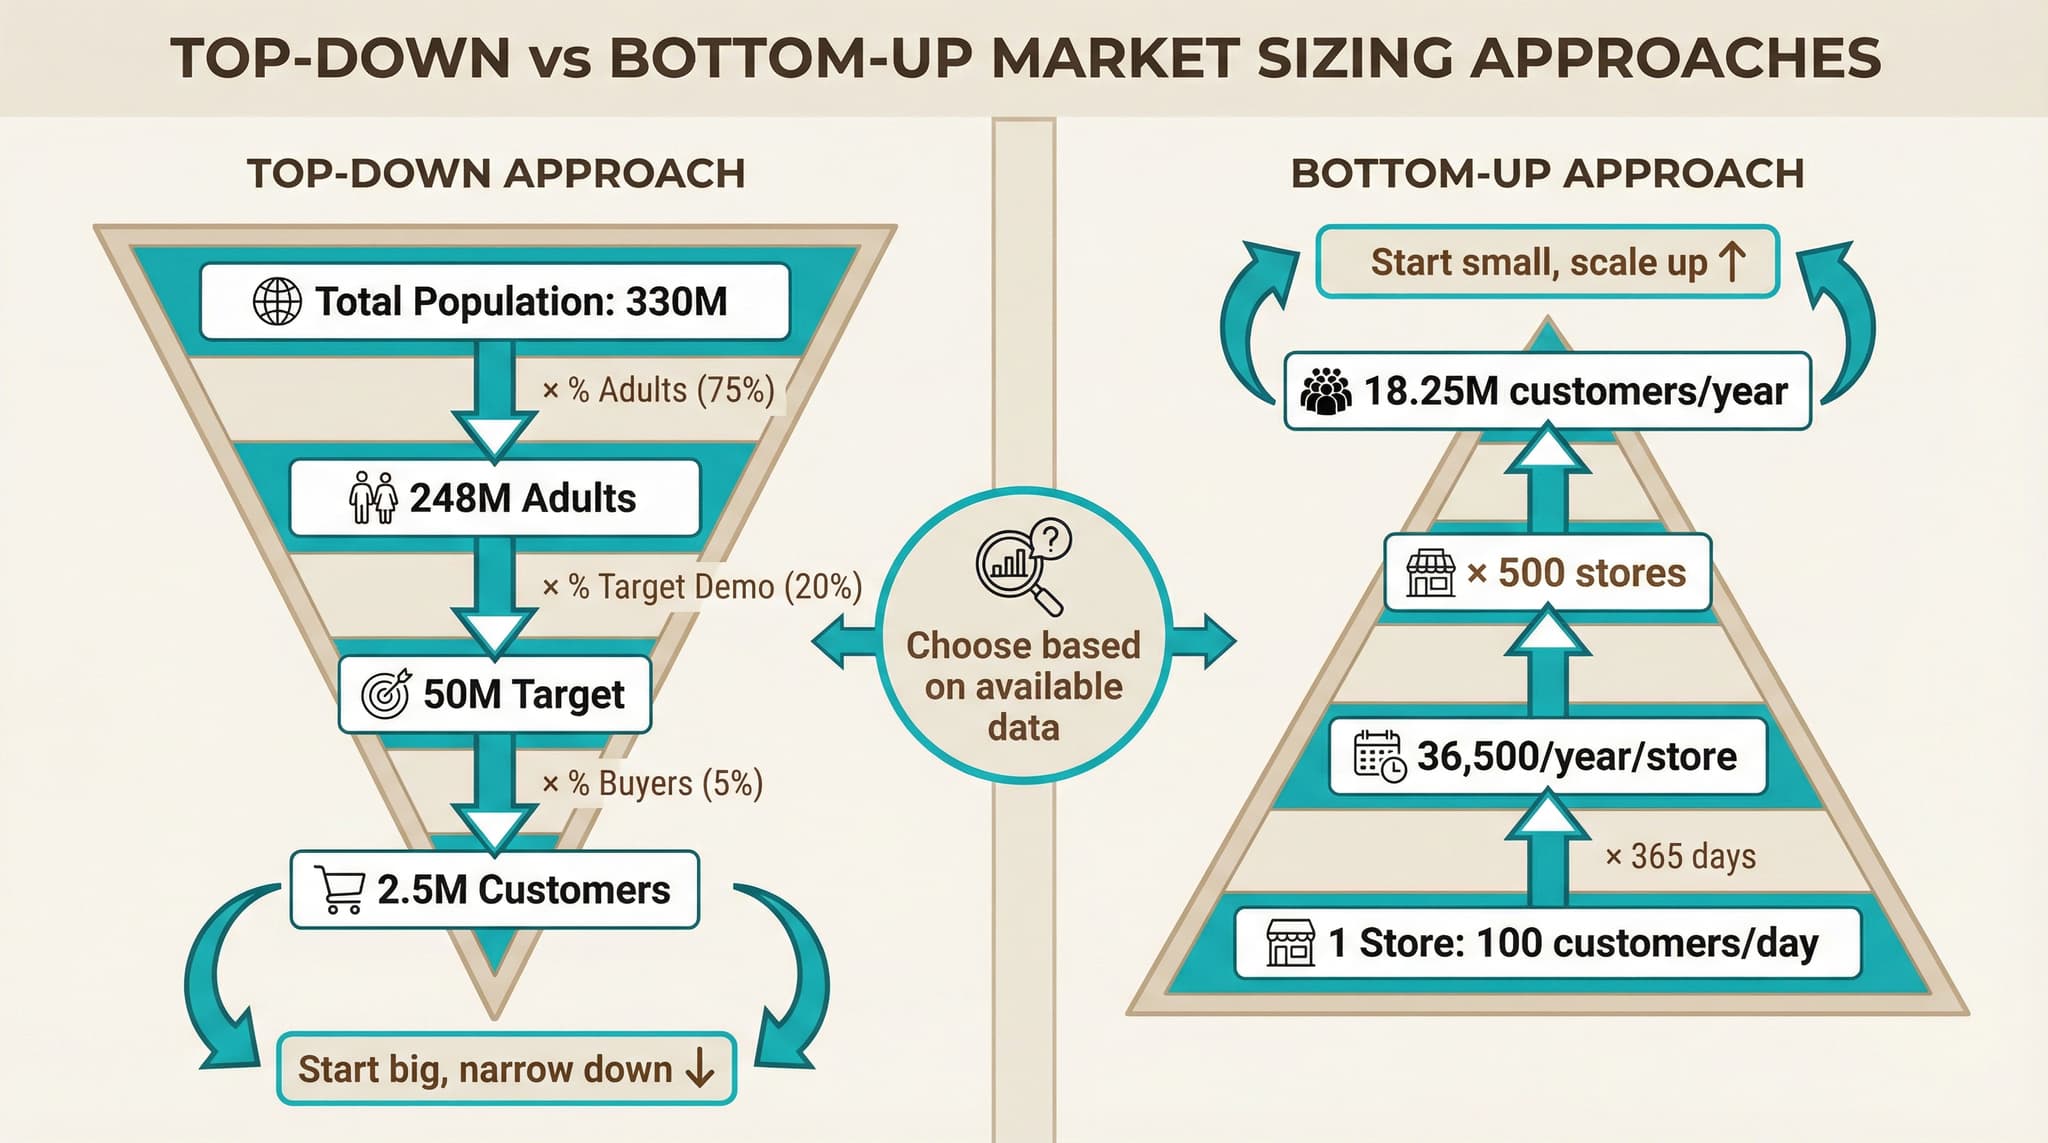
| Example | US pop (330M) → % adults (75%) → % who drink coffee (65%) → cups/day | Cups per coffee shop × shops per block × blocks in city |
When to use top-down
Top-down works well when you have a clear total population to start from and need to estimate broad markets. Questions like "What is the market size for toothpaste in the US?" or "How many cars are sold annually in Germany?" lend themselves to top-down. You start with population, filter by relevant demographics (households, adults, car owners), then estimate purchase frequency and price.
When to use bottom-up
Bottom-up works better when you can reasonably estimate a single unit and scale up. Questions about specific locations ("revenue of coffee shops in Manhattan") or B2B markets ("market size for industrial valves") often suit bottom-up. You estimate one store's daily sales, multiply by stores in an area, then scale to the full geography.
Tip: You can use both approaches on the same question as a sanity check. If top-down gives you 50 million and bottom-up gives you 500 million, something is off with your assumptions.
How should I structure my market sizing answer?
A clear structure makes your answer easier to follow and easier to calculate. Here is a reliable sequence:
1. Clarify the question (30 seconds)
Before calculating, make sure you understand what you are estimating. "Market size for coffee" could mean cups sold, revenue, or something else. Clarify geography, time period, and what units they want (volume vs. revenue). This also buys you thinking time.
2. Outline your approach (30 seconds)
Tell the interviewer how you plan to tackle it. "I will take a top-down approach, starting with the US population, filtering to coffee drinkers, estimating consumption frequency, then multiplying by average price." This shows structured thinking and lets them redirect you if needed.
3. Make calculations step by step (3-5 minutes)
Work through your logic, stating each assumption before using it. "I will assume 65% of US adults drink coffee regularly…" Write down key numbers. Keep arithmetic visible. Use round numbers to make mental math manageable.
4. State your answer and sanity check (1 minute)
Give your final number, then validate it. "That gives me roughly 400 million cups per day. Let me check: that is about 1.5 cups per adult American who drinks coffee, which seems reasonable." If something seems off, say so and explain what might drive the variance.
How do I make reasonable assumptions?
Assumptions are where market sizing succeeds or fails. Bad assumptions cascade through your calculations. Here is how to make them well:
Anchor to known facts
Start from things you actually know. Useful anchors include:
- US population: ~330 million
- NYC population: ~8 million
- Average household size: ~2.5 people
- Work days per year: ~250
- Life expectancy: ~80 years
- Hours in a day awake: ~16
Use your own experience wisely
Your behavior can inform assumptions, but be careful about generalizing. If you drink 3 coffees a day, the average person probably drinks less. If you never buy flowers, others might buy them weekly. State when you are using personal experience and acknowledge its limits.
Round aggressively
Use numbers that are easy to calculate with. 330 million becomes 300 million. 17% becomes 15% or 20%. The precision you lose is irrelevant since your assumptions already have large error margins. What matters is being able to calculate quickly and accurately.
Segment when it helps
Sometimes breaking a population into segments improves accuracy. Instead of assuming one coffee consumption rate for everyone, you might segment: office workers (high consumption), students (moderate), retirees (varies). Only do this if it meaningfully changes your estimate and you have time.
Key principle:State your assumption, give your reasoning, then use the number. "I will assume 60% of adults drink coffee. I know it is one of the most popular beverages, but not everyone drinks it daily." This shows your thinking and lets the interviewer challenge you if they want.
Worked example: How many coffee cups are sold in NYC per day?
Let us walk through a complete market sizing, showing how the pieces fit together.
Step 1: Clarify
"Just to confirm, we are estimating cups of coffee sold by coffee shops and cafes in New York City on a typical weekday, not including coffee made at home or at offices?"
(Interviewer confirms: Yes, just retail coffee sales.)
Step 2: Outline approach
"I will take a bottom-up approach. I will estimate how many cups a typical coffee shop sells per day, then estimate the number of coffee shops in NYC, and multiply."
Step 3: Calculate
Cups per coffee shop per day:
- Operating hours: roughly 14 hours (6am to 8pm)
- Morning rush (6-9am): 3 hours, maybe 60 cups/hour = 180 cups
- Midday (9am-2pm): 5 hours, maybe 30 cups/hour = 150 cups
- Afternoon (2-6pm): 4 hours, maybe 25 cups/hour = 100 cups
- Evening (6-8pm): 2 hours, maybe 15 cups/hour = 30 cups
- Total per shop: roughly 450-500 cups/day
Let me round to 400 cups per shop to be conservative.
Number of coffee shops in NYC:
- NYC population: ~8 million
- Estimate: roughly 1 coffee shop per 500 residents in Manhattan, fewer in outer boroughs
- Manhattan (~1.6M people): maybe 3,000 shops (1 per 500)
- Other boroughs (~6.4M people): maybe 4,000 shops (1 per 1,600)
- Total: roughly 7,000 coffee shops
Final calculation:
400 cups/shop × 7,000 shops = 2,800,000 cups per day
Answer: approximately 2.8 million cups per day
Step 4: Sanity check
"Let me verify this makes sense. With 8 million people in NYC, that is about 0.35 cups per person per day from coffee shops. Given that many people make coffee at home or at work, and children do not drink coffee, having roughly one-third of a cup per person from retail seems reasonable. The number might be higher on weekdays when commuters buy coffee, and lower on weekends."
Alternative approach (top-down):You could also start with NYC's working population (~4M), estimate what percentage buy coffee (50% = 2M), and assume 1.4 cups per buyer. That gives 2.8M cups, same ballpark. Using both methods and getting similar answers increases confidence.
Common market sizing questions
Here are frequently asked questions with suggested approaches:
"How many gas stations are in the US?"
Approach: Top-down from car ownership. US cars (~280M) → average miles driven per year → gallons consumed → how many cars a station serves → number of stations. Or bottom-up: stations per town size, scaled by US town distribution.
"What is the market size for diapers in the US?"
Approach: Top-down from births. Annual births (~3.6M) × average years in diapers (~2.5) × diapers per day (~6) × price per diaper. Gives you annual revenue. Consider segmenting by disposable vs. cloth.
"How many piano tuners are in Chicago?"
Approach: Estimate pianos in Chicago (households × ownership rate + institutions). Pianos need tuning 1-2x/year. Calculate annual tunings needed, divide by tunings a tuner can do per year (~1,000). Classic Fermi estimation.
"Revenue of a single McDonald's location?"
Approach: Bottom-up from transactions. Operating hours × transactions per hour (varies by time) × average ticket size. Segment into breakfast, lunch, dinner, and off-peak. Account for drive-through vs. dine-in differences.
"Market size for pet food in the US?"
Approach: Top-down from pet ownership. US households (~130M) × pet ownership rate (~65%) × spending per pet per year. Segment by dogs vs. cats since dogs eat more. Consider premium vs. standard food mix.
Practice these and similar questions in our market sizing drills. The more you practice, the faster you will recognize patterns and build reliable estimation instincts.
How do I sanity check my answer?
Always validate your final number. Sanity checking shows you think critically and catches errors before they become embarrassing.
Per capita checks
Divide your total by population to get a per-person number. If you estimate the US coffee market at $300 billion, that is roughly $1,000 per person per year, or about $20 per week. Does that seem right? Most people would say that is high for just coffee.
Comparison to known markets
Compare your estimate to markets you know. The US car market is roughly $500 billion. The smartphone market is around $80 billion. If your estimate for a niche product exceeds major industries, something is likely wrong.
Alternative calculation
If time allows, quickly check with a different method. If you used top-down, do a rough bottom-up. Getting the same order of magnitude increases confidence. Getting wildly different numbers means you should revisit assumptions.
Flag uncertainty
If your answer seems surprisingly high or low, say so. "This number seems higher than I expected. It could be because I overestimated the percentage of premium buyers. A more conservative estimate might be 30% lower." This shows analytical maturity.
Practice tips
Practice out loud
In interviews, you calculate while talking. If you practice silently, you will struggle to verbalize your thinking under pressure. Speak through every practice problem as if someone is listening.
Build your mental math
Market sizing requires multiplying and dividing large numbers quickly. If basic arithmetic slows you down, you will run out of time or make errors. Spend 10-15 minutes daily on mental math drills.
Memorize key anchors
Know basic numbers: US population, major city populations, number of households, average household size, life expectancy, GDP. These anchors make starting points instant instead of guessed.
Time yourself
Full market sizing should take 5-10 minutes. If you regularly go over, you are either overcomplicating your structure or struggling with calculations. Practice to hit target time consistently.
Look up actual numbers after
After practicing, research the real answer when possible. This calibrates your intuition over time. If you consistently overestimate markets, you will learn to adjust.
Market sizing improves with repetition. Start with 2-3 problems per week, then increase as you get faster. Our Academy includes market sizing practice with instant feedback to help you improve systematically.
Practice market sizing
CaseStar offers interactive market sizing drills with instant feedback on your structure, assumptions, and calculations.
Start practicingSave this guide
Updated April 2026