Profitability Cases: The Revenue-Cost Tree That Wins
Updated April 2026·12 min read
Summary: Profitability cases ask why profits are declining and what to do about it. Start with Profit = Revenue - Costs, but do not stop there. Break revenue into price, volume, and mix. Segment costs into fixed and variable, then by function. Follow the data to determine whether the problem is revenue, costs, or both. Avoid mechanical framework application by adapting to the specific industry and situation.
Contents
- What profitability cases test
- The basic equation and why it is just the start
- Revenue drivers: price, volume, mix
- Cost drivers: fixed, variable, and segmentation
- When revenue is the problem vs when costs are
- Common profitability case patterns
- How to avoid the framework robot trap
- Worked example approach
- FAQ
What profitability cases test
Profitability cases are the most common case type you will encounter. They test whether you can diagnose why a company is making less money than expected and recommend fixes. The prompt usually sounds like: "Our client is a regional retailer whose profits have declined 20% over two years. Why is this happening, and what should they do?"
On the surface, these cases test your ability to structure a business problem. But interviewers are really evaluating several things at once: Can you break down a vague problem systematically? Can you follow data to find the root cause rather than guessing? Can you generate actionable recommendations, not just observations?
The trap many candidates fall into is treating profitability cases as a framework exercise. They draw a tree, list the branches, and walk through each one mechanically. This approach misses the point. Interviewers want to see you think, not recite. The framework is a starting point for investigation, not the investigation itself.
The basic equation and why it is just the start
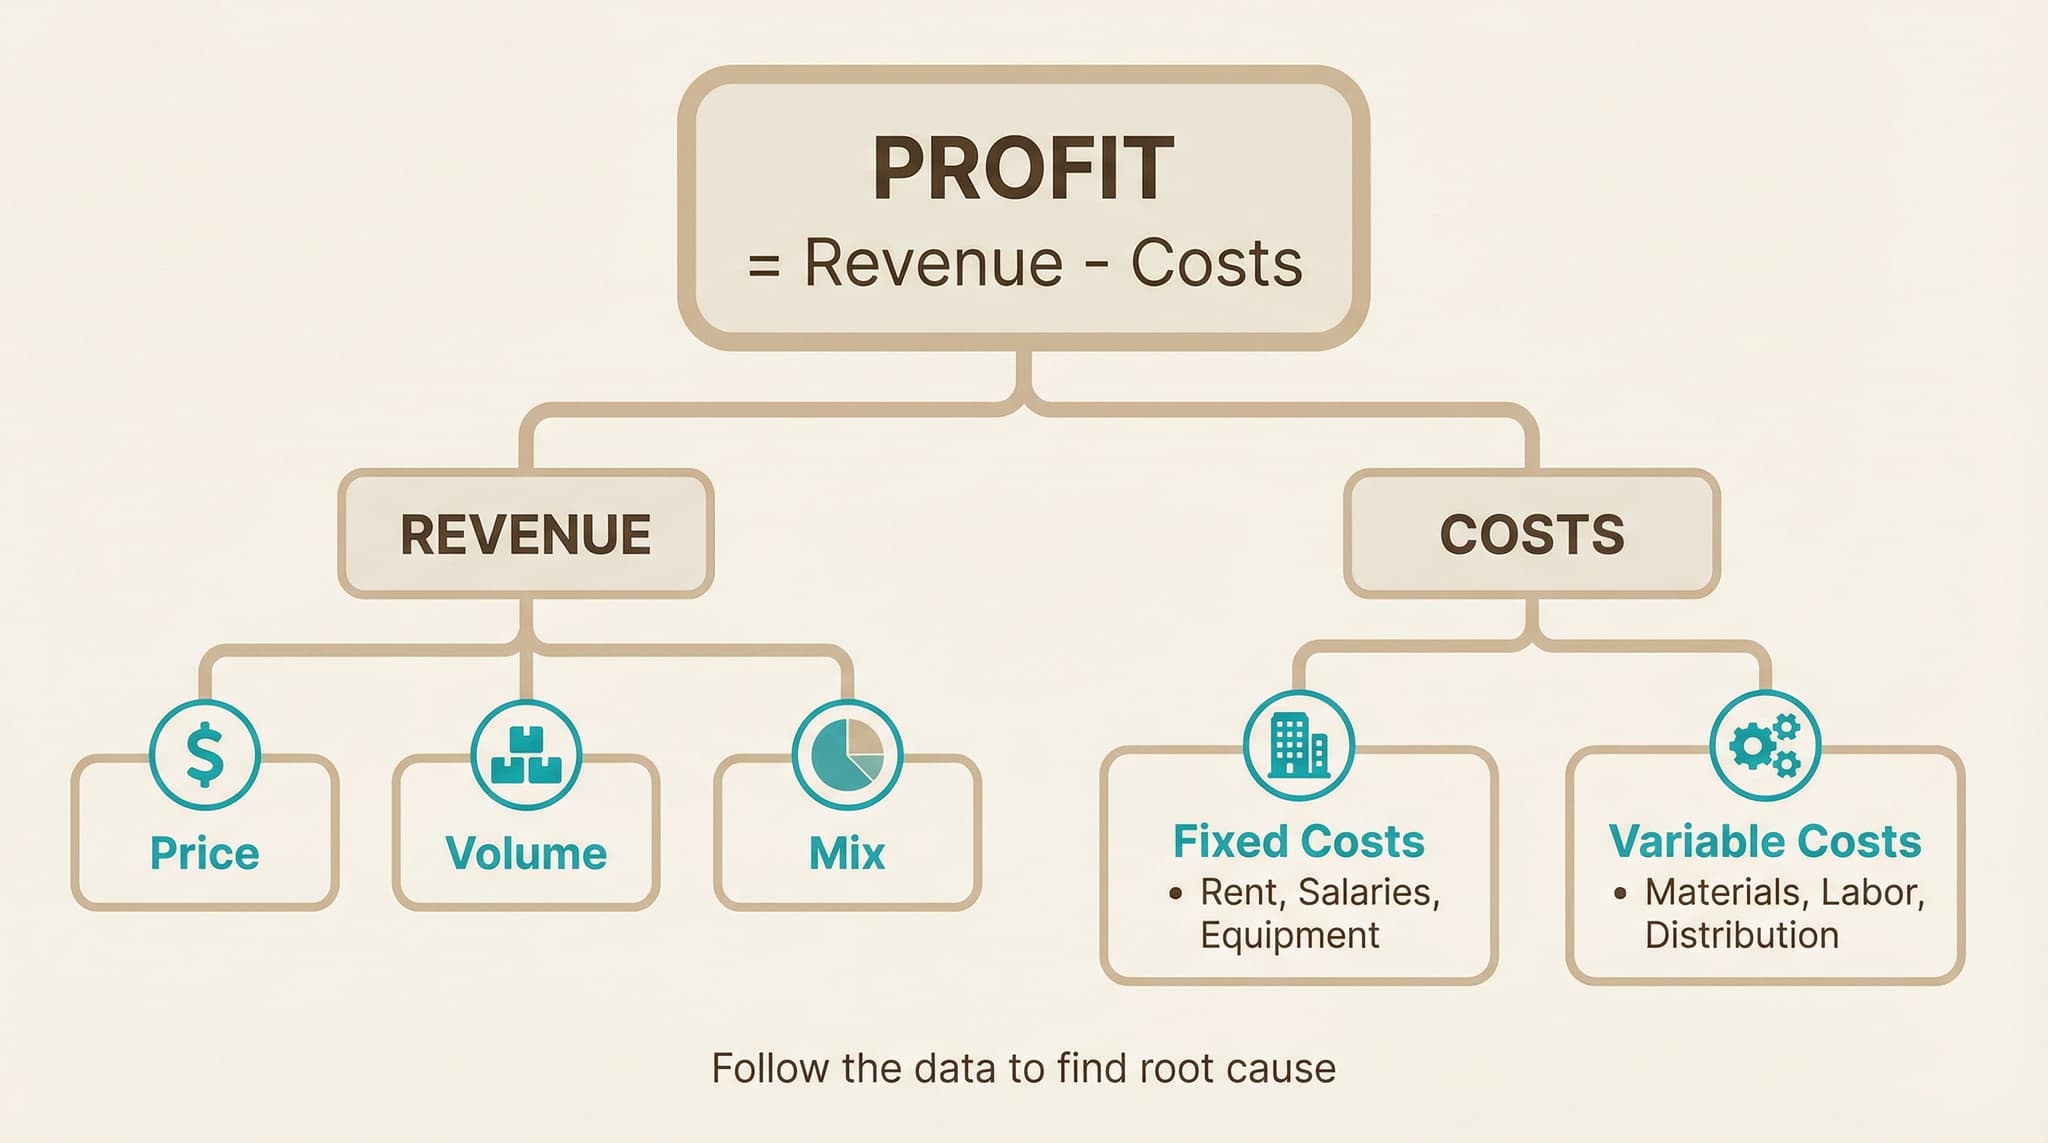
Every profitability analysis begins with the same equation:
Profit = Revenue − Costs
where Revenue = Price × Volume
Mix is a segmentation lever that affects weighted-average price and volume, but it isn't part of the core formula — you introduce it when you break Price and Volume down by product or customer segment.
This is not insight. Every business student knows this equation. The value is in how you use it. Think of it as the first level of a decision tree. Profit is down. Is revenue down, are costs up, or both? Your next step depends on the answer.
Many candidates stop here conceptually. They draw "Revenue" and "Costs" as two branches and think they have a framework. But this is too shallow. A regional retailer with declining profits could have dozens of underlying causes: a new competitor took market share, their product mix shifted toward lower-margin items, labor costs increased, their lease renewed at higher rates, or their supply chain became less efficient. Each requires different analysis.
The equation tells you where to look. Decomposing each side tells you what to look for. That decomposition is where the real work happens.
Revenue drivers: price, volume, mix
Revenue breaks down into three components. Each has different implications for diagnosis and recommendations.
Price
Has average selling price changed? Declining prices might indicate competitive pressure, commoditization, or deliberate discounting. Increasing prices might mask underlying volume problems. Compare to competitors and to inflation.
Volume
Are they selling fewer units? This could be market-wide (the whole category is shrinking) or company-specific (losing share to competitors). Ask whether the market is growing, flat, or declining. If the market grew but the client did not, they lost share.
Mix
Has the product or customer mix shifted? Maybe total units sold stayed flat, but customers migrated from premium products to basic ones. Or the fastest-growing customer segment generates lower margins. Mix shifts can erode revenue even when price and volume look stable.
When analyzing revenue, always ask: compared to what? Revenue down 10% means something different if the market shrank 15% (the client outperformed) versus if the market grew 5% (the client significantly underperformed). Context determines whether a number is good or bad.
Cost drivers: fixed, variable, and segmentation
Costs require two levels of breakdown. First, the classic fixed versus variable distinction. Second, functional segmentation to identify where specifically costs have changed.
| Category | Type | Examples | Key Questions |
|---|---|---|---|
| Fixed Costs | Facilities | Rent, utilities, maintenance | Lease renewals? Expansion? Utilization? |
| Overhead | Corporate staff, IT systems, insurance | Headcount creep? New systems? Admin bloat? | |
| Depreciation | Equipment, vehicles, buildings | Recent capital investments? Asset age? | |
| Variable Costs | COGS | Raw materials, components, packaging | Input price changes? Supplier issues? |
| Labor | Production workers, sales commissions | Wage increases? Productivity changes? | |
| Distribution | Shipping, logistics, fulfillment | Fuel costs? Route efficiency? Returns? |
The fixed/variable distinction matters because the levers differ. Fixed costs are often harder to cut quickly but have bigger impact per decision. Variable costs scale with volume, so improving them multiplies across every unit sold.
When costs have increased, ask about timing. Did something specific change? A new warehouse, a wage increase, a supplier switch? Or has there been gradual drift without clear cause? Specific changes are easier to address than diffuse inefficiency.
When revenue is the problem vs when costs are
You need to determine quickly which side of the equation deserves more attention. Here are signals that point in each direction.
Revenue is likely the issue when:
- Sales are declining or flat while costs are stable
- Market share has dropped
- Competitors are growing faster
- Prices have eroded
- Customer complaints or churn have increased
- Product is becoming commoditized
Costs are likely the issue when:
- Revenue is stable but margins are shrinking
- Input costs have spiked (materials, labor, energy)
- Recent expansion or capital investment
- Operational metrics have deteriorated
- Headcount has grown faster than revenue
- Integration issues after acquisition
Often both matter. Revenue might be down 10% and costs up 5%. In that case, prioritize by magnitude. If declining revenue accounts for 70% of the profit impact, that is where you should focus first. Quantify both and let the numbers guide your depth.
Common profitability case patterns
After enough cases, you start recognizing patterns. Here are the most frequent storylines and what to look for in each.
New competitor entered
Volume dropped because a new player took share. Look at: customer segments most affected, pricing comparison, feature differences, switching costs. Recommendations often involve differentiation, customer retention, or selective price matching.
Price erosion from commoditization
The product became interchangeable with competitors, so prices fell. Look at: industry price trends, differentiation opportunities, cost position versus competitors, adjacent markets. Recommendations might include adding services, focusing on niches, or accepting lower margins and cutting costs.
Input cost spike
Raw material, labor, or energy costs increased faster than prices. Look at: which inputs changed and why, competitor response, ability to pass through costs, alternative suppliers or substitutes. Recommendations involve cost reduction, pricing adjustments, or hedging strategies.
Mix shift to lower margins
Total units sold stayed flat, but the mix moved toward lower-margin products or customers. Look at: segment-level profitability, why the shift happened, whether high-margin segments can be recaptured. Recommendations focus on premium positioning, segment-specific strategies, or accepting the new reality.
Operational inefficiency creep
Costs drifted upward without clear cause. Too many people, too much overhead, processes that accumulated complexity. Look at: benchmarks versus competitors, cost per unit trends, organizational changes. Recommendations involve process improvement, headcount optimization, or zero-based budgeting.
Recognizing patterns helps you ask better questions early. But be careful not to assume. Each case has its own specifics. Use patterns as hypotheses to test, not conclusions to force.
How to avoid the framework robot trap
The "framework robot" walks through every branch of their structure regardless of whether it matters for this case. They spend equal time on revenue and costs even when the data clearly points to one. They use generic terms like "price and quantity" instead of language specific to the industry.
Interviewers recognize this immediately and it hurts your evaluation. Here is how to avoid it:
Adapt your language to the industry
If the client is a hospital, talk about patient volume and reimbursement rates, not "units sold and price per unit." If it is an airline, discuss load factor and yield. Show that you understand the business, not just the formula.
Follow the data, not the structure
When the interviewer gives you numbers showing revenue is flat, do not spend ten minutes brainstorming revenue drivers. Acknowledge revenue looks stable, note what you would check to confirm, and move to costs. Let evidence guide your depth.
Skip branches that obviously do not apply
If the client is a pure-play online retailer, do not ask about store lease costs. If they have one product, do not explore product mix at length. Knowing what to skip shows judgment.
State your hypothesis early
After laying out your structure, tell the interviewer where you think the answer might be and why. "Given the competitive entry mentioned in the prompt, I suspect we are seeing volume decline from lost market share. I would like to start there." This shows business thinking, not just process.
For more on building adaptive frameworks, see our frameworks guide.
Worked example approach
Here is how a strong candidate might approach a profitability case in practice.
Prompt: "Our client is a mid-size furniture manufacturer. Profits have declined 15% over two years while revenue stayed roughly flat. What is going on and what should they do?"
Step 1: Clarify
Ask about the client: B2B or B2C? Product range? Geographic scope? Ask about the profit decline: Which years? Gradual or sudden? Have competitors seen similar issues? This takes 60 seconds and shapes everything after.
Step 2: Structure with a hypothesis
"Since revenue is flat but profits dropped 15%, costs are likely the main driver. I would structure this by looking at cost of goods sold, which includes materials and direct labor, then operating expenses like sales and admin overhead. Given furniture manufacturing, I suspect material costs or production efficiency might be the culprit. Let me start by asking about input costs."
Step 3: Drill down based on data
Suppose the interviewer says lumber prices increased 25% due to supply chain issues. Now you quantify: What percentage of COGS is lumber? If it is 40%, and lumber is up 25%, that is a 10% increase in COGS. With typical furniture margins, that could explain most of the profit decline. Confirm this math, then explore solutions.
Step 4: Generate recommendations
Given the lumber cost issue: Can they negotiate better with suppliers? Diversify supplier base? Switch to engineered wood for some products? Pass through price increases to customers? Improve yield to waste less material? Size the top two or three options to see which moves the needle most.
Step 5: Synthesize
"The profit decline is driven primarily by a 25% increase in lumber costs, which accounts for roughly two-thirds of the shortfall. I recommend a three-part response: first, negotiate with current suppliers while adding two alternative sources to increase competition. Second, redesign the three highest-volume products to use engineered wood where structurally possible. Third, implement a 5% price increase on new orders, which customer research suggests the market will absorb. Together, these could recover 80% of the lost margin within 18 months."
Notice how the structure serves the investigation rather than dominating it. The candidate followed the data to lumber costs, quantified the impact, and generated specific recommendations. That is what interviewers want to see.
To practice profitability cases with feedback, try our profitability lesson or start a practice case.
FAQ
What is the profitability framework?
It starts with Profit = Revenue - Costs. Revenue breaks into price, volume, and mix. Costs divide into fixed and variable. But the framework is a starting point, not a checklist. Good candidates customize their analysis based on what the specific case requires.
How do I know if the problem is revenue or costs?
Ask about trends. If revenue declined while costs stayed flat, focus on revenue. If revenue is stable but margins are shrinking, costs are the issue. The case prompt and clarifying questions usually point you toward the bigger lever.
How deep should I go into each branch?
Follow the data. If revenue figures look normal, do not spend ten minutes on revenue ideas. If revenue dropped 30%, that is where the story is. Let the numbers guide your depth, not a predetermined structure.
How do I avoid sounding like a framework robot?
Adapt to the case specifics. Use industry-specific language. Skip branches that do not apply. State hypotheses. Show you are investigating a real business problem, not just filling in a template.
Should I calculate everything?
Calculate the major initiatives, not every idea. A rough estimate showing one initiative saves $50M while another saves $2M is more valuable than precise math on minor items. Focus quantification on what moves the needle.
What if both revenue and costs are problems?
Quantify each and prioritize by magnitude. If revenue decline accounts for 70% of the profit impact, start there. Acknowledge both issues in your structure but allocate your time based on which one matters more.
Practice profitability cases
CaseStar offers interactive case practice with instant feedback on your structure, analysis, and recommendations.
Start practicingSave this guide
Last updated: April 2026