Operations Cases: How to Approach Them
Updated April 2026·15 min read
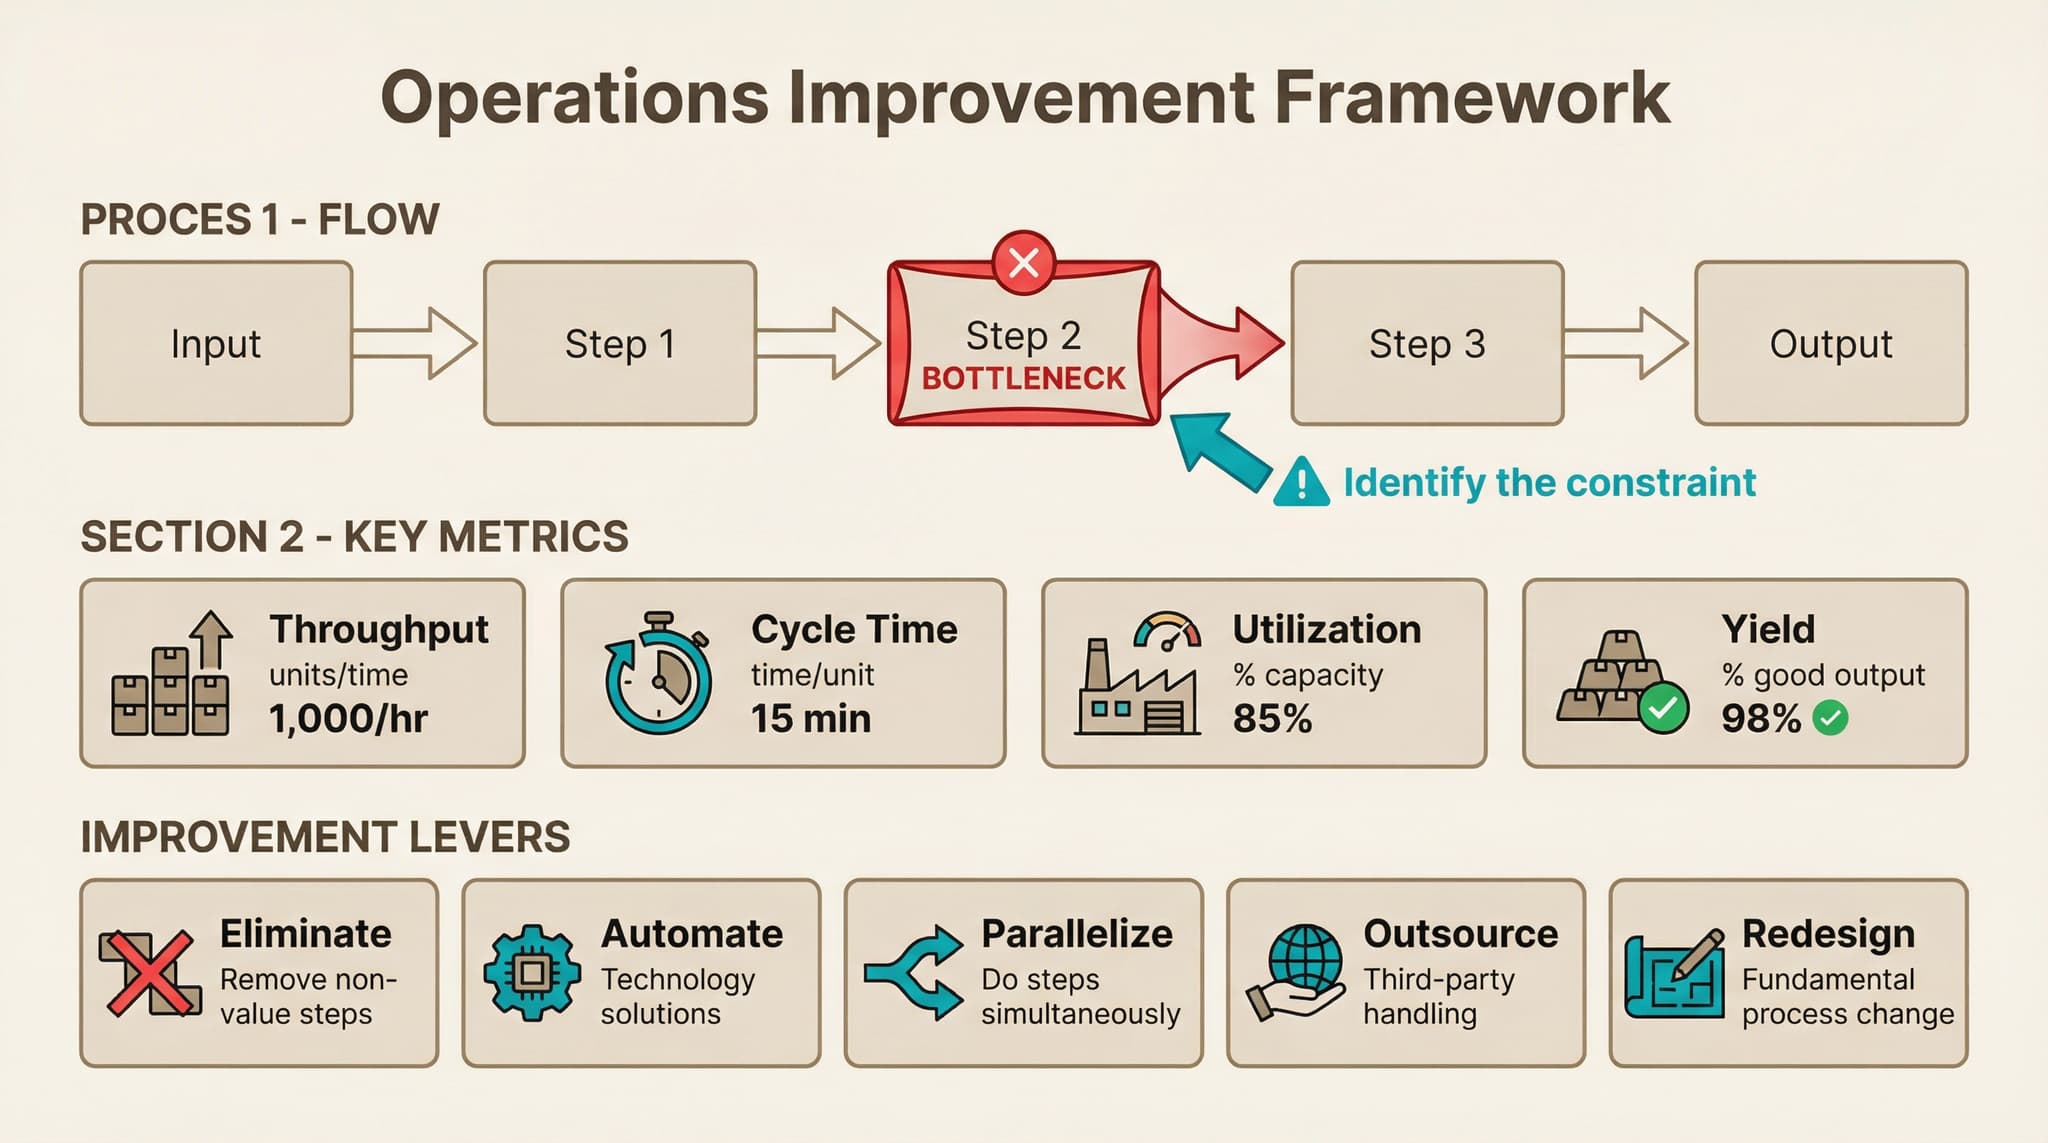
Summary: Operations cases focus on improving processes, reducing waste, and increasing efficiency. Start by mapping the current process to visualize the workflow. Identify the bottleneck - the constraint limiting output. Measure the right metrics: throughput, cycle time, utilization, and yield. Then apply improvement levers: eliminate non-value steps, automate, parallelize, outsource, or redesign. The goal is always to produce more, faster, cheaper, or with higher quality.
Contents
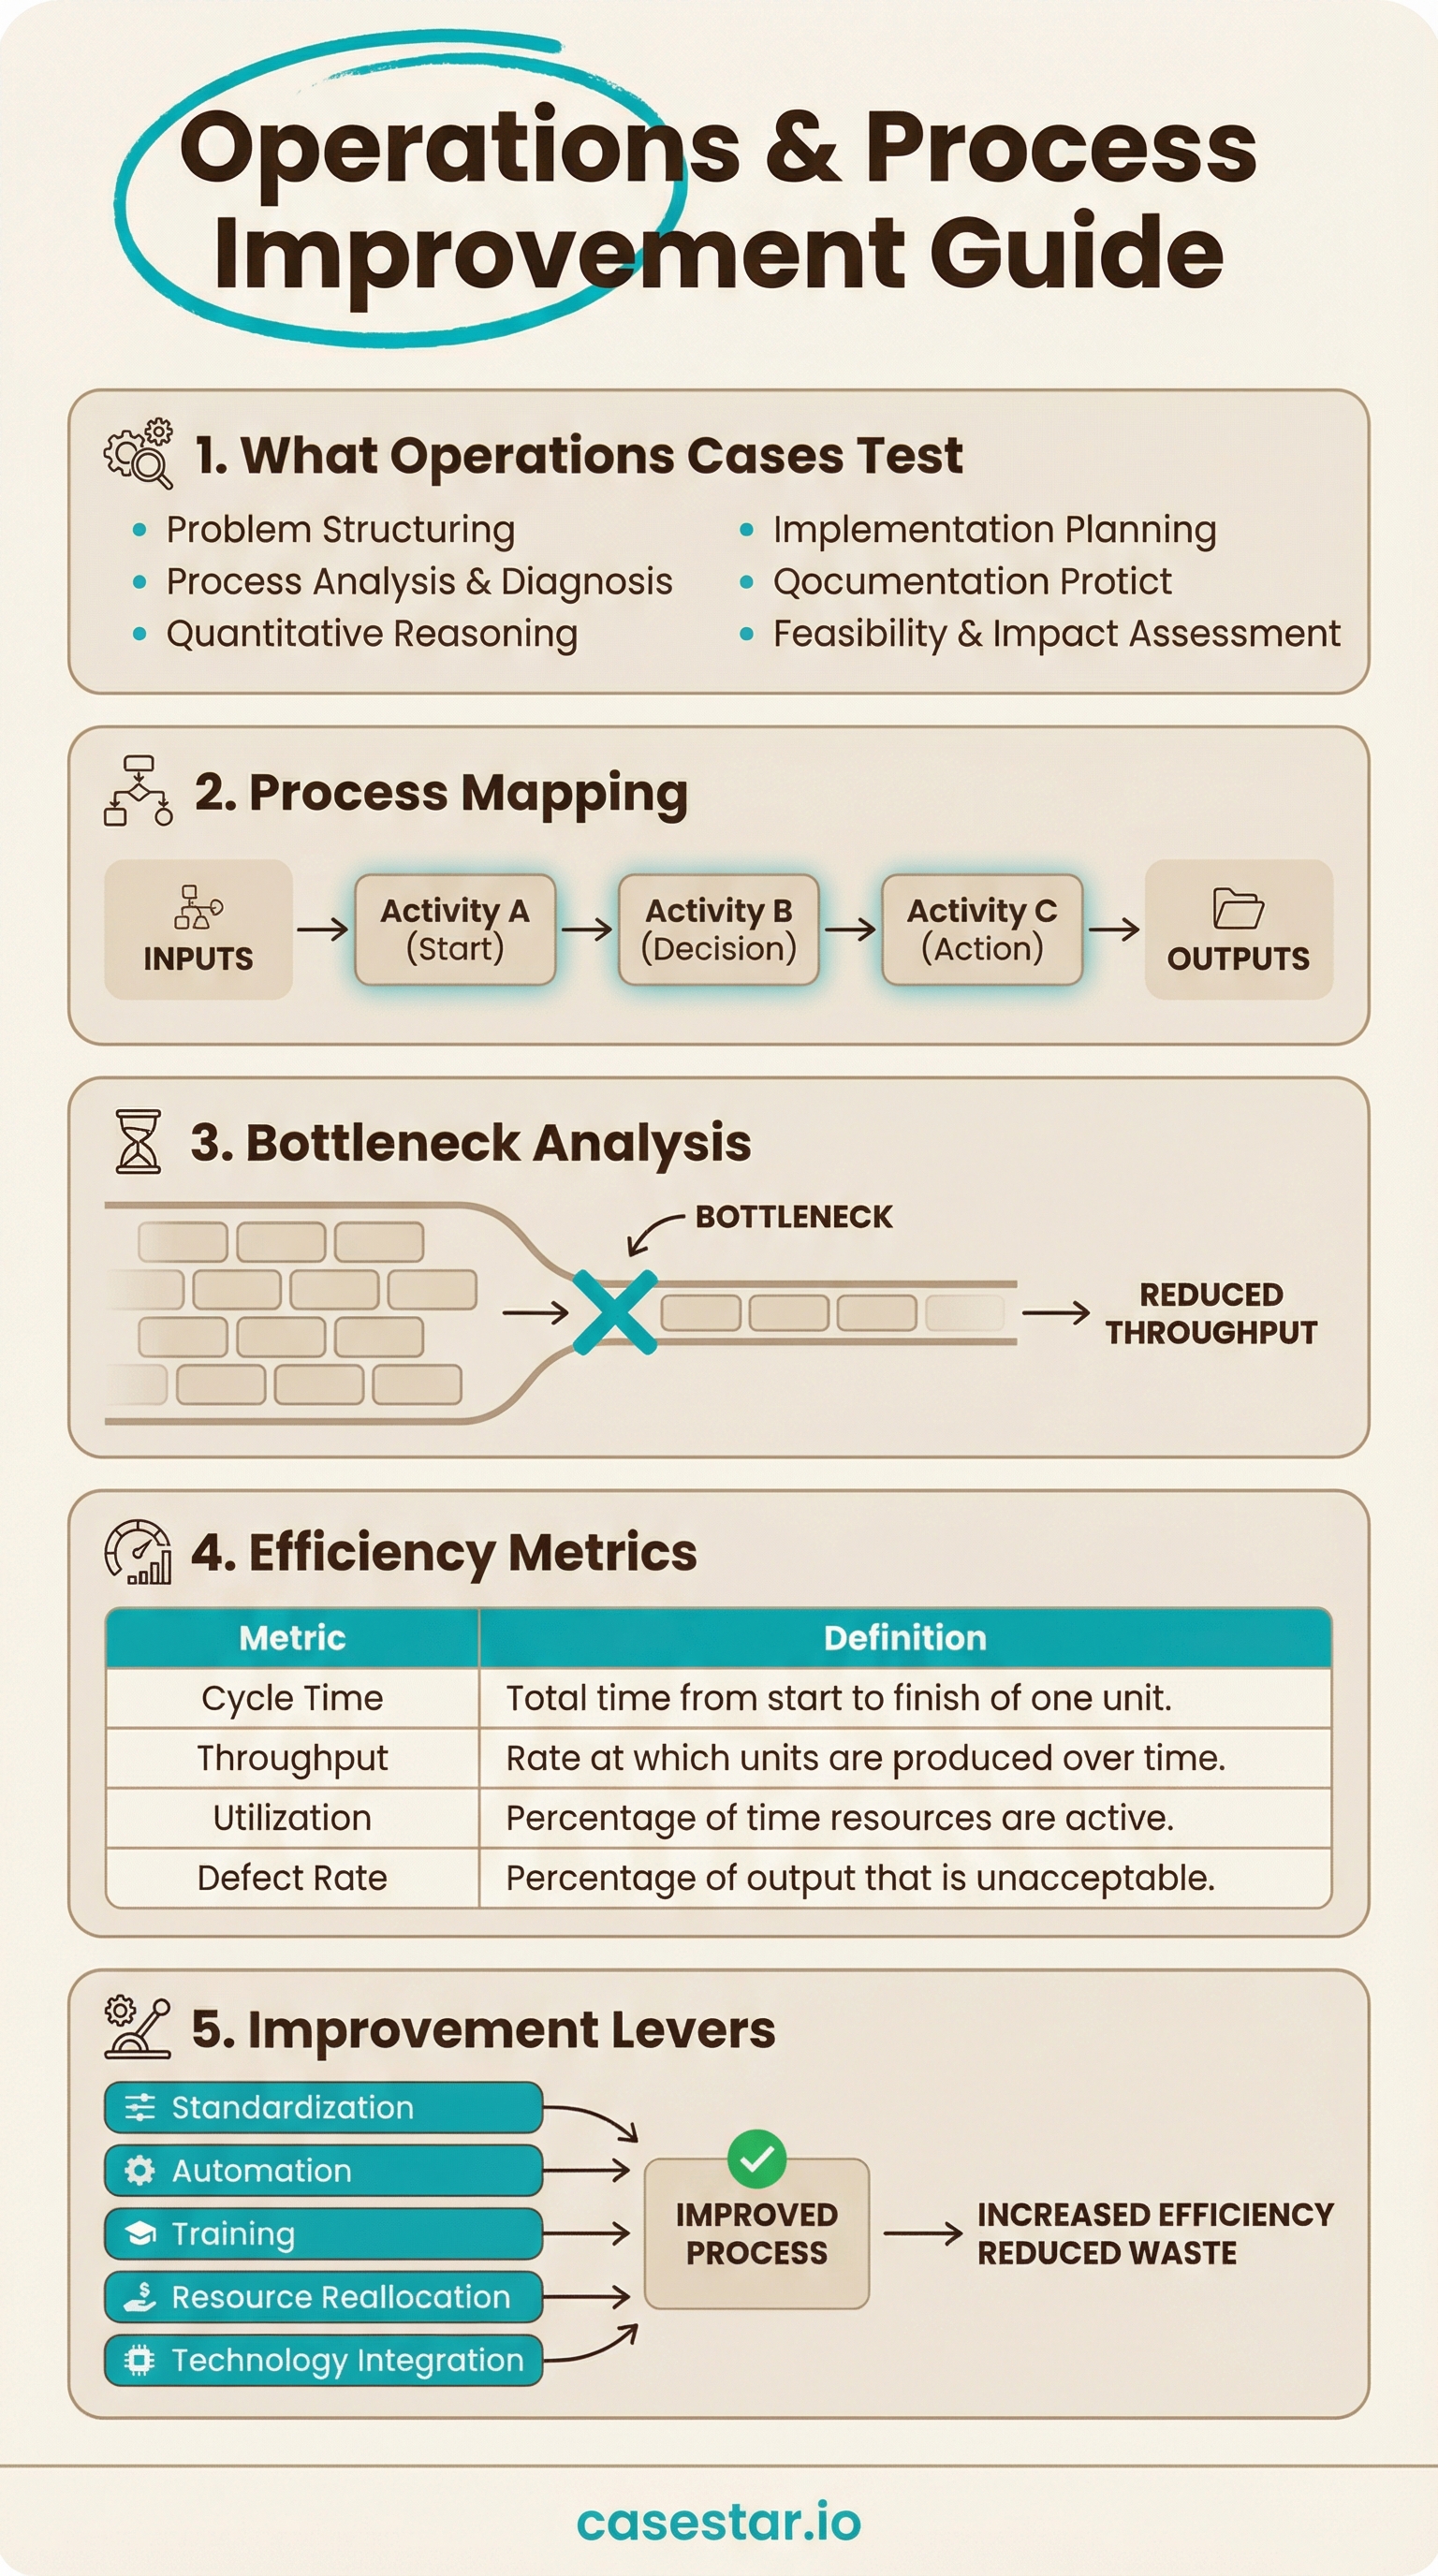
What operations cases test
Operations cases evaluate your ability to analyze and improve business processes. Unlike profitability cases that focus on revenue and cost drivers, operations cases dive into the "how" - how work gets done, where it breaks down, and how to make it better.
These cases are especially common at operations-focused firms like Deloitte Strategy & Operations, Oliver Wyman, and in manufacturing or supply chain contexts. The prompt often sounds like: "Our client is a manufacturer whose production line cannot keep up with demand. How would you approach this?"
Interviewers assess several skills in operations cases:
- Process thinking: Can you visualize how work flows through a system?
- Analytical rigor: Can you identify the true constraint vs. symptoms?
- Quantitative skills: Can you calculate throughput, cycle time, and capacity?
- Practical solutions: Can you propose realistic improvements with clear impact?
Process mapping: visualize the workflow
Before you can improve a process, you need to understand it. Process mapping creates a visual representation of each step, who does it, how long it takes, and where handoffs occur. This is your diagnostic tool for finding inefficiencies.
For each step in the process, gather:
- Activity: What work is being done?
- Time: How long does this step take?
- Resources: Who or what performs this step?
- Capacity: How many units can this step handle?
- Handoffs: What happens next, and is there waiting time?
Value-Added vs. Non-Value-Added
Classify each step as value-added (customer would pay for it) or non-value-added (waiting, rework, transport, inspection). In most processes, only 5-10% of time is value-added. The rest is waste waiting to be eliminated.
Swim Lane Diagrams
When multiple departments or teams are involved, use swim lanes to show who owns each step. This reveals handoffs - a major source of delays. Every time work crosses a swim lane, there is potential for waiting, miscommunication, or dropped balls.
Tip: In interviews, sketch the process flow on paper. Even a simple linear diagram with boxes and arrows demonstrates structured thinking and helps you organize information as you receive it.
Bottleneck analysis: Theory of Constraints
The Theory of Constraints (TOC) is fundamental to operations cases. Every process has one constraint - the bottleneck - that limits total output. The entire system can only produce as fast as its slowest step.
Why Bottlenecks Matter
Improving non-bottleneck steps has zero impact on total output. If your bottleneck can process 100 units per hour, it does not matter if other steps can handle 200 - you are still capped at 100. Focus all improvement efforts on the bottleneck first.
How to Identify the Bottleneck
Look for the step with the highest utilization (closest to 100%) or the longest queue of work waiting. Ask: where does inventory pile up? Where are people or machines constantly busy while others wait? The bottleneck is often obvious once you map the process.
The 5 Focusing Steps
- Identify the constraint (bottleneck)
- Exploit the constraint (maximize its output)
- Subordinate everything else to the constraint
- Elevate the constraint (add capacity)
- Repeat - find the new bottleneck
Key insight: Once you fix one bottleneck, another step becomes the new constraint. Continuous improvement means repeatedly identifying and addressing the current bottleneck.
Key operations metrics
Four metrics form the core language of operations. Understanding and calculating these is essential for any operations case.
| Metric | Definition | Formula |
|---|---|---|
| Throughput | Output rate - how many units produced per time period | Units / Time (e.g., 500 units/day) |
| Cycle Time | Total time to complete one unit from start to finish | Process Time + Wait Time |
| Utilization | Percentage of available capacity being used | Actual Output / Max Capacity x 100% |
| Yield | Percentage of output meeting quality standards | Good Units / Total Units x 100% |
Throughput vs. Cycle Time
These are related but distinct. Throughput is system-level (how fast the whole process produces). Cycle time is unit-level (how long each unit spends in the system). You can have high throughput with long cycle time if you have many units in process simultaneously - like an assembly line with many stations.
Utilization Sweet Spot
High utilization (90%+) sounds efficient but creates long queues and wait times. Low utilization wastes capacity. The sweet spot is typically 70-85%, leaving buffer for variability. Bottleneck steps should run at maximum utilization; non-bottlenecks should have slack.
Hidden Factory: Yield Impact
Low yield creates a "hidden factory" - capacity consumed by rework or scrap. If yield is 80%, you need to produce 125 units to get 100 good ones. Improving yield directly increases effective capacity without adding resources.
The 5 improvement levers
Once you understand the process and identify constraints, apply these five levers to drive improvement. Consider them in order - eliminating waste is often easier than redesigning from scratch.
1. Eliminate
Remove non-value-adding steps entirely. Ask: "What would happen if we stopped doing this?" Common targets include unnecessary approvals, duplicate data entry, excessive inspection, and over-processing.
Example: Remove the 3-signature approval process for orders under $1,000.
2. Automate
Use technology to replace manual, repetitive tasks. Automation reduces errors, increases speed, and frees people for higher-value work. Look for rules-based, high-volume activities.
Example: Auto-generate invoices when shipment tracking shows delivery.
3. Parallelize
Run steps simultaneously instead of sequentially. If Step A and Step B have no dependency, do them at the same time. This dramatically reduces total cycle time.
Example: While waiting for credit approval, start warehouse picking.
4. Outsource
Transfer non-core activities to specialized third parties who can do them better, faster, or cheaper. Focus internal resources on what differentiates the business.
Example: Use a 3PL for warehousing instead of running your own facility.
5. Redesign
Fundamentally rethink the process from a blank slate. Ask: "If we were starting fresh, how would we do this?" Redesign is the most powerful lever but also the most difficult and risky.
Example: Shift from batch processing to continuous flow manufacturing.
Tip:When presenting recommendations, quantify the impact. "Parallelizing steps 3 and 4 reduces cycle time by 2 days, freeing up 15% of capacity." Concrete numbers make your analysis actionable.
Common operations scenarios
Operations cases typically fall into three categories. Understanding the goal helps you focus your analysis.
Reduce Costs
The client wants to do the same thing more cheaply. Focus on eliminating waste, improving yield (reducing scrap/rework), consolidating steps, or substituting cheaper inputs.
Key questions: Where is money being wasted? What steps consume the most resources without adding value? Can we achieve the same quality with less?
For cost analysis, see our profitability guide.
Increase Capacity
The client cannot meet demand with current operations. Focus on bottleneck analysis first - identify what limits output. Then apply levers to increase throughput at the constraint.
Key questions: Where is the bottleneck? Can we add shifts, equipment, or people at the constraint? Can we reduce changeover time? Can we improve yield at the bottleneck?
Improve Quality
The client has too many defects, returns, or customer complaints. Focus on finding where quality issues originate (not just where they are detected). Apply root cause analysis.
Key questions: Where do defects occur in the process? What is the root cause (people, machines, materials, methods, environment)? Can we build in quality checks earlier?
Where You Will See These
Operations cases are especially common at Deloitte Strategy & Operations, Oliver Wyman, and in industry-focused practices at other firms. Manufacturing, logistics, healthcare, and retail clients frequently have operations-focused problems. See our frameworks guide for how operations thinking integrates with other case types.
Worked example approach
Prompt: "Our client is a medical device manufacturer. Their production line is running at full capacity but they need to increase output by 20% to meet new demand. How would you approach this?"
Step 1: Clarify and Map
Ask about the production process: how many steps, what are the key stages? What is the current throughput and how is it measured? What are the operating hours - 1 shift, 2 shifts, 24/7? What is the current yield rate? Are there any known quality issues?
Step 2: Find the Bottleneck
"Before looking at solutions, I need to identify what is constraining output. Could you tell me the utilization of each major stage?" [Interviewer reveals that final testing is at 98% utilization while other stages are at 70-80%.] "So final testing is our bottleneck. Any improvement needs to focus there."
Step 3: Analyze Metrics at the Constraint
"Let me understand the testing step better. What is the cycle time per unit? What is the yield - how many pass on first attempt?" [Interviewer reveals 30-minute test time, 85% first-pass yield.] "So 15% need retesting, which consumes additional capacity. If we improved yield to 95%, we would recover 10% of capacity right there."
Step 4: Apply Improvement Levers
"To get 20% more output, I see several options at the testing bottleneck: First, reduce failures by identifying root causes of the 15% that fail - this is the eliminate lever. Second, could we run two tests in parallel? Third, can we add a second testing station? Finally, are there any non-essential tests we could eliminate or move to sampling?"
Step 5: Recommendation
"I recommend a two-part approach. Short-term: improve first-pass yield from 85% to 95% by implementing upstream quality checks - this gives us ~12% more effective capacity at testing with minimal investment. Medium-term: add a second testing station for the remaining 8% - the payback should be strong given current demand. Together these achieve the 20% increase. I would also investigate whether any tests can be parallelized to further reduce cycle time."
FAQ
What is the operations case framework?
The operations framework has four steps: Map the process to visualize workflow; Identify the bottleneck using Theory of Constraints; Measure key metrics (throughput, cycle time, utilization, yield); Apply improvement levers (eliminate, automate, parallelize, outsource, redesign).
What are the 5 improvement levers?
Eliminate (remove non-value steps), Automate (use technology), Parallelize (run steps simultaneously), Outsource (transfer to specialists), and Redesign (rethink from scratch). Apply them in roughly this order - elimination is often easier than redesign.
How do I calculate throughput?
Throughput = Output / Time. For example, if a line produces 480 units in an 8-hour shift, throughput is 60 units/hour. The maximum throughput is limited by the bottleneck step. Improving non-bottleneck steps will not increase overall throughput.
When do operations cases appear vs. profitability cases?
Operations cases focus on "how" work gets done - process efficiency, capacity, quality. Profitability cases focus on "what" drives financial results - revenue streams, cost structure, margins. Often they overlap: improving operations can reduce costs or enable revenue growth. See our profitability guide for that framework.
What if I cannot identify the bottleneck from the information given?
Ask! "Which step has the highest utilization?" or "Where do you see work-in-process inventory building up?" If the interviewer does not have this data, structure your analysis: "To identify the constraint, I would measure utilization at each step and find where queues form. Let me hypothesize that the bottleneck is in [most likely step] and test that."
Practice operations cases
CaseStar offers interactive case practice with instant feedback on your process analysis and improvement recommendations.
Start practicingSave this guide

Last updated: April 2026