CaseStar field guide · McKinsey Solve
McKinsey Red Rock Study: the complete 2026 guide
The McKinsey Red Rock Study (often written Redrock) is the first game in McKinsey Solve. You get 35 minutes to collect evidence, run 2–4 calculations, complete a one-way report with a chart choice, then answer 6 standalone mini-cases. It tests percentages, weighted averages, growth rates and chart selection under heavy time pressure. This guide explains each phase, the math behind it, how to pace 35 minutes and what the scoring is likely to reward, with original worked examples.
What is the McKinsey Red Rock Study?
Red Rock is the first of up to three games in McKinsey Solve, McKinsey’s gamified problem-solving assessment. You play a researcher on Redrock Island. A short brief gives you a research objective, a page of narrative, and two or three tables or charts. You collect the evidence that matters, calculate from it, write it up in a structured report, and then answer six unrelated mini-cases, all on one 35-minute clock.
McKinsey’s own material describes Solve only broadly: it confirms each task starts with an untimed tutorial and that scenarios differ between candidates. Everything more specific below comes from candidate debriefs, and we label it that way. The table is the version we build our simulator against.
| Detail | What candidates report | Source |
|---|---|---|
| Position in the sitting | First, before Sea Wolf and Sustainable Future Lab | Candidate reports |
| Time | 35 minutes on one clock for the study and the cases | Candidate reports |
| Study phases | Investigation → Analysis → Report | Candidate reports |
| Analysis | 2–4, usually 3 calculation questions, some with sub-parts | Candidate reports |
| Report | A paragraph with 8–10 blanks, then one chart choice you cannot change | Candidate reports |
| Mini-cases | 6 short cases, about 2 minutes each | Candidate reports |
| Navigation | Investigation and Analysis stay navigable; the Report is one-way | Candidate reports |
| Calculator | Available from Analysis onward | Candidate reports |
| Rounding | The study asks for two decimal places; the cases carry no rounding instruction (CaseStar’s cases state the precision they are marked to, so marking is unambiguous) | Candidate reports |
| Untimed tutorial | Every task starts with one | McKinsey |
| Scoring | Never published by McKinsey | McKinsey |
Red Rock key facts
- Candidate reports collected up to 24 September 2026 put the McKinsey Red Rock Study at 35 minutes on a single clock that covers the study and the mini-cases.
- Red Rock is the first of up to three McKinsey Solve games in 2026, followed by Sea Wolf (30 minutes) and, on longer invites, Sustainable Future Lab (20 minutes), according to candidate reports up to 24 September 2026.
- The Red Rock study has three phases — Investigation, Analysis and Report — and candidates report that the Report is one-way: once you enter it, you cannot return to the study.
- Candidates report 6 standalone mini-cases after the Red Rock study, at about 2 minutes each, and none of them uses the study's data.
- Red Rock Analysis usually has 2–4 calculation questions (most often 3), and candidates report answers are requested to two decimal places.
- The Red Rock Report is a paragraph with 8–10 blanks followed by one chart choice that cannot be changed, according to candidate reports up to 24 September 2026.
- McKinsey states that every Solve task starts with an untimed tutorial and has never published how Solve is scored (McKinsey Solve FAQ, August 2025).
- The math on Red Rock is school-level — percentages, percentage points versus percent change, ratios and shares, weighted averages, growth rates and CAGR — done quickly and without a personal calculator.
Where Red Rock sits in the sitting
In 2026 the games come in a fixed order: Red Rock, then Sea Wolf, then Sustainable Future Lab on longer invites. A 65-minute invite covers the first two games; an 85-minute invite adds the third. Since August 2026 invites have been worded as approximately 95 minutes, plus 20 minutes for instructions and the technical check. Because Red Rock comes first, it is also where candidates lose time to the tutorial handover: several report that the tutorial ended without announcing it and the clock was already running.
What does a Red Rock study look like from start to finish?
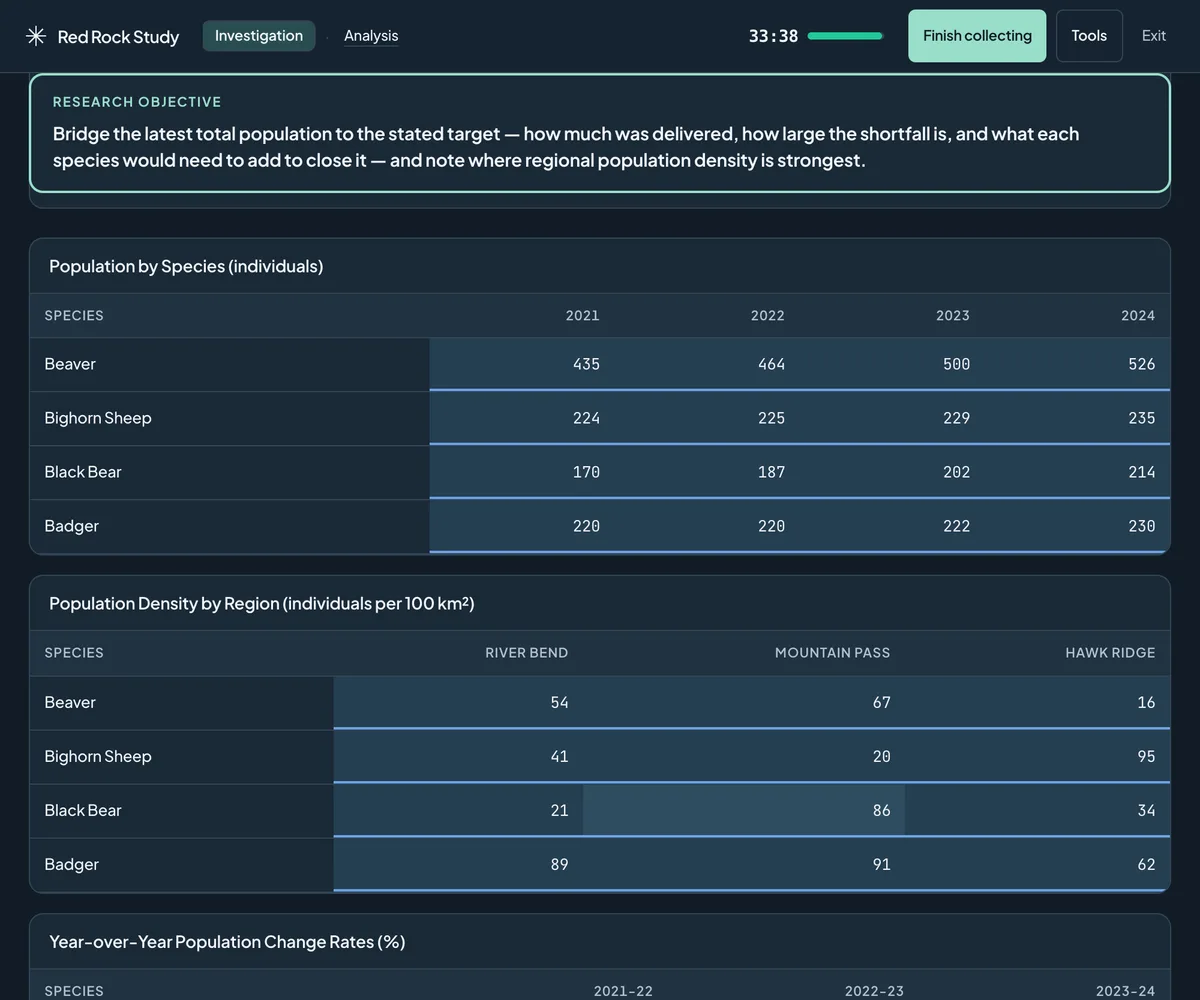
To make the phases concrete, here is a compact study written for this guide. It is simpler than a real one, but it has the same shape.
The brief
The objective reads: “The island council will fund one extra ranger for the region where river otters make up the largest share of recorded wildlife in 2024. Recommend the region.” The narrative mentions a dry spring, a new visitor centre, a count of 1,200 tourists and the fact that surveys in the North Bank region were extended by two weeks. Below it sit a table of 2024 counts by species for three regions, a line chart of island-wide otter numbers from 2020 to 2024, and a table of ranger salaries.
What to collect
The objective needs, for each region, the 2024 otter count and the 2024 total. That is six facts from one table. The otter trend line, the salaries, the tourists and the dry spring are noise for this objective. The extended survey in North Bank is worth a moment of thought: it could inflate raw counts, but because the objective uses shares within each region, it affects numerator and denominator alike. A good journal holds six labelled entries and nothing else.
The analysis
Suppose the counts are North Bank 96 otters of 640 animals, Cedar Marsh 75 of 410, and High Moor 60 of 520. The shares are 15.00%, 18.29% and 11.54%. A likely sub-question then asks by how many percentage points the winning region leads the next one: 18.29 − 15.00 = 3.29 points. A second might ask what share of all recorded otters Cedar Marsh holds: 75 ÷ 231 = 32.47%.
The report
The paragraph would read something like: “In 2024, river otters made up the largest share of recorded wildlife in [Cedar Marsh], at [18.29]%, [3.29] percentage points ahead of [North Bank]. We recommend funding the additional ranger in [Cedar Marsh].” The chart choice follows the message: comparing one measure across three categories is a bar chart, and the values you enter are the three shares.
Notice what the study did not need: the trend over five years, any salary figure, or the largest raw otter count (North Bank has the most otters, which is exactly the tempting wrong answer). Red Rock rewards reading the objective carefully more than anything else.
Phase 1, Investigation: what should you collect?
The study opens with a research objective. A typical one reads like “estimate next year’s otter population across the reserve” or “identify the region where the conservation budget achieved the most per animal”. Underneath sit a narrative of a few paragraphs and two or three exhibits: population counts by year, densities by region, a budget table, a line chart.
Your job is to drag the facts you will need into the research journal. There is no calculator in this phase. That is deliberate: Investigation tests whether you can decide what is relevant before you start computing. Candidates consistently report that roughly half of the material is noise, such as rainfall, tourism counts or staffing notes that sound important but do not feed the objective.
How to decide what to save
- Start from the objective, not the exhibits. Write the formula you expect to need, in words: “2024 otters ÷ 2024 total”. Every term in it is a fact to collect.
- Save the label with the number. A journal entry that says 418 is useless ten minutes later. You need “River otter · 2024 · 418 individuals”.
- Watch the period and the unit. Exhibits often cover five years and mix counts with densities per km². The most common silent error is saving the right entity from the wrong year.
- Skip facts you can derive. If you save each region’s count, you do not also need the total unless the exhibit gives it and you want a check.
- Leave after about five minutes. You can come back from Analysis if you missed something. The clock does not come back.
Whether McKinsey scores what you collect is not public. It is plausible that a process score looks at it, and it is certain that a cluttered journal slows you down in the next phase. Either way the habit is the same: collect deliberately.
Phase 2, Analysis: how many calculations are there?
Analysis usually brings three questions, sometimes two or four. Some have sub-parts, for example 3a asks for a total and 3b for a share of it. The calculator unlocks here. Answers you submit carry forward into the report, so an early mistake does not stay contained.
The study asks for answers to two decimal places. Keep full precision until the final step: rounding an intermediate share from 24.26% to 24% and then multiplying it by a population of 12,400 moves the answer by more than thirty animals.
Worked example · Analysis
A growth rate, then a projection
The reserve counted 1,500 bighorn sheep in 2022 and 1,860 in 2024. (a) What was the growth over the two years? (b) If the same two-year growth rate continues, what population do you project for 2026?
Show the working
(a) Growth is measured against the starting value: (1,860 − 1,500) ÷ 1,500 = 360 ÷ 1,500 = 24.00%.
(b) Apply the same rate once more: 1,860 × 1.24 = 2,306.40, so about 2,306 animals. A common error is to add the 360 again (2,220), which assumes linear growth when the question asked you to keep the rate constant.
Using the calculator well
Candidates describe the built-in calculator as accurate but slow. Two habits help. First, estimate before you type: 360 ÷ 1,500 is “a bit under a quarter”, so 24% passes and 2.4% does not. Second, calculate each quantity once, write it in your notes with its label, and reuse it instead of re-deriving it for the next question.
Phase 3, Report: how do the blanks and the chart choice work?
The report is a pre-written paragraph with 8–10 blanks. Some are dropdowns (“increased / decreased”, “Region A / Region B”), others take values you calculated or collected. Then you choose one chart type to present the finding. Candidates report that the choice cannot be changed, and that you then enter the chart’s values.
Entering the report ends the study: there is no going back to Investigation or Analysis. Before you click through, check that every value the objective needs is in your journal or notes.
Worked example · Report
Pick the chart that answers the objective
The objective is to show how the otter and beaver populations changed from 2020 to 2024 and when otters overtook beavers. Which chart do you choose: pie, line, stacked bar or scatter?
Show the working
A line chart. The message is a change over time for two series, and a line chart shows the trend and the moment the lines cross. A pie chart shows one period’s composition and hides the trend. A stacked bar can show both totals but makes the individual series hard to compare. A scatter plot is for the relationship between two variables, such as budget and density, not for time.
The chart rule of thumb: time → line; parts of one whole → pie or 100% stacked bar; comparing categories → bar; relationship between two measures → scatter; bridging from one total to another → waterfall.
How many mini-cases are in Red Rock?
After the study come 6 standalone cases. Each has its own short text or exhibit, usually on a related theme, and none uses the study’s data. Candidates report multiple-choice and numeric answers: a percentage change, a weighted average, a probability, a ratio, the best chart for a message, or a quick judgement about what a table does or does not show. The research journal resets between cases and completed cases lock.
At roughly 2 minutes each, the cases reward speed and a willingness to move on. If a case stalls you, choose your best estimate and continue; an answered case can score, an unreached one cannot. We publish six original Red Rock mini-case examples with full working.
What math is on the Red Rock Study?
Nothing beyond school arithmetic, done fast and without errors: percentages, percentage points versus percent change, ratios and shares, weighted averages, growth rates and CAGR, basic probability, choosing a chart type. Three rules prevent most lost marks:
- Name the denominator. Growth divides by the start value, a share divides by the total, a rate divides by the time or area it covers.
- Percent is not percentage points. A share moving from 12% to 15% is +3 percentage points and +25%.
- Average of rates is not the rate of the total. Two regions growing 10% and 30% only grow 20% together if they are the same size. Weight by size, or compute from the totals.
Our Red Rock math guide covers each skill with worked examples and the trap it hides.
How long is the Red Rock Study, and how should you pace it?
The clock is shared, so nothing stops Analysis from eating the cases. Use this split as a default:
| Phase | Minutes | Checkpoint |
|---|---|---|
| Investigation | 5 | Leave by 30:00 remaining |
| Analysis | 12 | Leave by 18:00 remaining |
| Report | 5 | Leave by 13:00 remaining |
| Six mini-cases | 12 | About 2:00 each |
| Buffer | 1 | One check, not a review |
Write the checkpoints down before you start. When you pass one late, cut the current phase short rather than borrowing from the cases: a guessed report blank costs one mark, while two unreached cases cost at least two.
How is Red Rock scored?
McKinsey has never published its scoring model. The widely repeated description is a product score, whether your answers are right, and a process score, how you worked. Vendors speculate about which process signals count; nobody outside McKinsey knows. What is well corroborated is the result itself: the email does not include a score, but candidates who ask the recruiting inbox are often told a raw score and a decile, compared with candidates for the same role, region and test version.
Practically, accuracy is the one thing you can fully control, so optimise for it first and treat a tidy process as a way to be accurate faster. Read more in how the McKinsey Solve score and decile work.
What are the most common Red Rock mistakes?
- Spending too long in Investigation. Reading every paragraph twice feels careful and costs you the cases.
- Collecting numbers without labels. You will not remember which 418 was which.
- The wrong year or unit. Counts and densities per km² look alike in a journal.
- Percent vs percentage points. Read the unit in the blank before calculating.
- Averaging rates. The overall rate comes from the totals, not from the mean of the parts.
- Rounding early. Round once, at the end, to two decimal places.
- Choosing a chart for its looks. Match the chart to the message: time, composition, comparison or relationship.
- Not reaching cases 5 and 6. The single most common regret in candidate debriefs.
See which phase costs candidates the most in practice: where candidates lose marks in Red Rock, from CaseStar practice data.
How should you prepare for Red Rock in seven days?
- Day 1: read this guide, then play the untimed tutorial logic in your head: objective → journal → calculation → report. Try the free 8-minute sample and note where you hesitated.
- Day 2: math drills on percentages, percentage points and growth, 20 minutes without a calculator.
- Day 3: one full 35-minute sitting. Record your time at each checkpoint.
- Day 4: review every wrong answer and name the error: period, unit, denominator, rounding or chart. Drill the weakest one.
- Day 5: mini-cases only, strict 2-minute limit per case.
- Day 6: a second full sitting on a new scenario. Compare checkpoints with Day 3.
- Day 7: rest, check your equipment against the official FAQ and read the integrity rules.
Only three days? Do Days 1, 3 and 4. The review of your own errors is worth more than a third sitting.
Is there a free Red Rock practice test?
The McKinsey Red Rock simulator is built on the candidate-reported format above: a research objective, exhibits with deliberate noise, a research journal, a calculator that unlocks in Analysis, a one-way report with a paragraph to fill and a chart choice you cannot change, and six mini-cases, all on one 35-minute clock. The default setting is a wildlife field study, as in the real test. Scenarios are generated, so the species, numbers and questions change every run and you practise the method rather than memorising answers. It is independent practice, not McKinsey’s software, and it will differ from your test in details.
Free: an 8-minute sample with no sign-up, and one full 35-minute sitting with an email. The sample is the opening eight minutes of a Red Rock study, with no sign-up: collect evidence, run two calculations, fill a short report and answer one mini-case, then see each answer worked through. Further full sittings come with the Solve Pass: €69 once, with unlimited Red Rock runs plus Sea Wolf, Sustainable Future Lab and the full Solve mock, valid until seven days after your test date (at least 30 days). Our scores and feedback are CaseStar’s practice model, not McKinsey’s.
Ways to practise Red Rock, compared
What each kind of preparation can and cannot give you. The rows describe methods, not named products.
| Method | Timed 35-minute sitting | Journal, calculator and one-way report | New data every attempt | Feedback on your own answers |
|---|---|---|---|---|
| Reading guides and watching walkthroughs | No | Described, not practised | No | No |
| Paper or PDF question sets | Only if you time yourself | No | No: fixed questions | Answer key only |
| Working with a coach or study partner | Possible | No | Depends on their material | Yes, from a person |
| CaseStar Red Rock simulator | Yes, 35 minutes with 6 mini-cases | Yes | Yes: a new scenario every run | Yes: every answer, the evidence you saved and your pacing |
Preparing for the whole assessment? See the McKinsey Solve guide and Red Rock vs Sea Wolf.
Common questions
How long is the McKinsey Red Rock Study?
Candidates report 35 minutes on a single clock that covers the three-phase study and the 6 mini-cases. McKinsey does not publish per-game timings; your invitation states the total length of your assessment.
Is Red Rock the same as Redrock?
Yes. Candidates and prep sites use both spellings. The on-screen name candidates report is “Redrock Study”, set on a fictional Redrock Island.
How many questions are in Red Rock?
Candidates report around 14 scored decisions in the real test (CaseStar’s practice sittings score more items, 27–28, so each skill gets practice): 2–4, usually 3 analysis questions (some with sub-parts), a report paragraph with 8–10 blanks and a chart choice, and 6 mini-cases.
Can I go back to Investigation during Analysis?
Candidates report that Investigation and Analysis stay navigable, so you can return to the source material. The Report is the one-way gate: once you enter it, the study is over.
Do I need to finish all six mini-cases?
You should try to. Unanswered cases score nothing, and several candidates who reported never reaching cases 5 and 6 described it as their biggest regret. Protect about twelve minutes for the cases.
Is Red Rock harder than Sea Wolf?
It depends on your strengths. Red Rock rewards reading, arithmetic and chart judgement under time pressure; Sea Wolf rewards systematic filtering against constraints. Many candidates find one much harder than the other.
Can I use Excel or my own calculator?
No. McKinsey’s integrity rules prohibit outside tools, AI, pre-prepared notes and other assistance during Solve, except for approved accommodations. Use the built-in calculator, which candidates report unlocks in Analysis.
Is there a free Red Rock practice test?
Free: an 8-minute sample with no sign-up, and one full 35-minute sitting with an email. The sample is the opening eight minutes of a Red Rock study, with no sign-up: collect evidence, run two calculations, fill a short report and answer one mini-case, then see each answer worked through. After that free full sitting, further 35-minute sittings come with the Solve Pass.
Sources and limits
- McKinsey: Solve assessment overview and integrity rules
- McKinsey: Solve FAQ (August 2025)
- PrepLounge: “Didn’t perform well in Red Rock, did well in Sea Wolf”
- PrepLounge: McKinsey Solve, June 2026, Paris
- PrepLounge: Advice for McKinsey Solve
- PrepLounge: Advice to succeed on Redrock
- CaseStar: what changed in McKinsey Solve in 2026 (dated change log with confidence labels)
CaseStar (casestar.io) is an independent practice platform for consulting recruiting: timed McKinsey Solve simulators, including Red Rock, and voice case interviews. It is not affiliated with McKinsey & Company.
McKinsey publishes only a broad description of Solve. Details labelled as candidate-reported come from debriefs and can differ between candidates, regions and test versions. Worked examples on this page are original CaseStar exercises, not assessment questions. Your invitation and recruiter take precedence.